Fine-Tuning Stop Losses
Parts I and II in this series made the case for stop losses in options trading … and stop profits. To use stops well, it’s critical to understand how to determine the optimal stop-loss level.
In this issue of luckbox, the Tactics section explores stop losses. The Basic article, Stop Losses, tests using stop losses in short option trades, and the intermediate article, Stop Profits, tests the performance of incorporating both stop losses and active management into a short options portfolio. The studies indicate that combining stop losses and profit taking tends to pay off by yielding greater average P&L and controlling large losses. Let’s take that research a step further by testing the performance of varying stop loss levels.
The level of the stop loss can have a big impact on a portfolio’s performance, so this study will test a variety of stop losses. These types of stop losses are defined as tight and loose and each has pros and cons. Tight stop losses allow for only small losses, which results in lower portfolio volatility. Loose stop losses, on the other hand, may experience large losses but also give the trade more time to bounce back and become profitable, resulting in a higher win rate. Which strategy’s better?
Let’s test the performance of varying stop losses by using the same back-testing framework used in the Basic and Intermediate articles of this Tactics series.
- Data Date: 2005 through 2019
- Underlying Asset: SPY
- Approximate Option Delta: 50 (At-the-Money)
- Approximate Days to Expiration: 30
- Managed Short Puts at 50% Potential Max Profit
- Managed Tight Stop Losses at 25%, 50% and 75% of the Premium Received
- Managed Loose Stop Losses at 100%, 200% and 300% of the Premium Received
- Number of Occurrences: 3,400
Tight stop losses mean that if the original short put collects $5 in credit and the max profit is $500, the stop loss will kick in when the losses reach $125, $250 and $375, respectively. Loose stop losses mean that the same short put will close when losses reach $500, $1,000 and $1,500, respectively.
As in the previous two studies, this analysis examines the annualized return on capital (ROC), win rate and largest loss of each management strategy. The annualized ROC explains how much return a trader can expect to make for a given amount of capital deployed. Win rate describes the portion of trades that were profitable, and the largest loss is a measure of risk that highlights the worst performing trade’s P&L.
As seen in “Stop-Loss Performance,” below, all of the stop losses reduced the largest loss when compared to holding the trade to expiration. This shouldn’t be much of a surprise. More surprising, however, are the changes in the ROC and the win rate. Although incorporating stop losses reduced the largest losses when compared to holding to expiration, it did so at the expense of a lower ROC and win rate. The tighter the loss control, the lower the win rate. This matches the original assumption that looser stop losses allow more time for trades to become profitable.
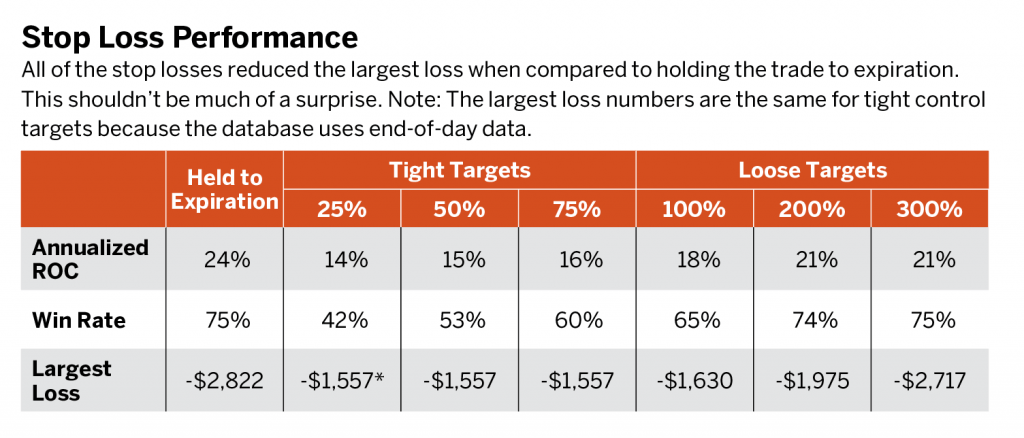
When managing losses at 25% of the option price, the probability of being profitable is only 42%—worse than the odds at a casino roulette table. Additionally, the ROC is worse than holding the trade to expiration when traders don’t apply any management! On the other hand, the loose stop loss at 300% only marginally reduces the largest loss but sacrifices 300 basis points in the ROC. There is a clear dilemma in using these stop losses:
- Tightening the stop loss increases the number of the unprofitable trades, which directly hurts the annualized ROC.
- Loosening the stop loss increases the win rate and ROC but ultimately defeats the point of incorporating a stop loss because losses are similar to just holding to expiration.
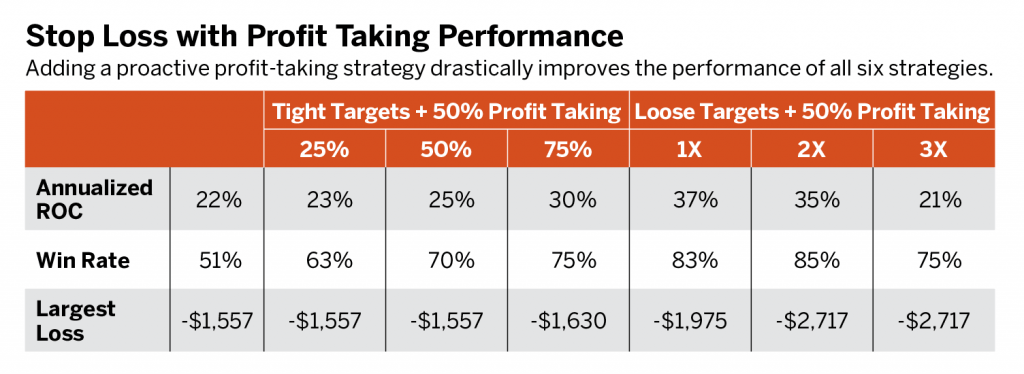
The analysis in the Intermediate article, Stop Profits, of this series indicates that to achieve greater performance it’s important not only to manage losses but also to manage winning trades proactively. How might the performance change for these tight and loose stop losses if a trader also incorporates a profit-taking strategy? In this piece, profits will be managed at 50%. For example, a short put sold for $5 will be closed when the profits are $250.
As seen in “Stop Loss with Profit Taking Performance,” below, adding a proactive profit-taking strategy drastically improves the performance of all six management strategies. Managing losers and winners has a positive impact on both the annualized ROC and the win rate.
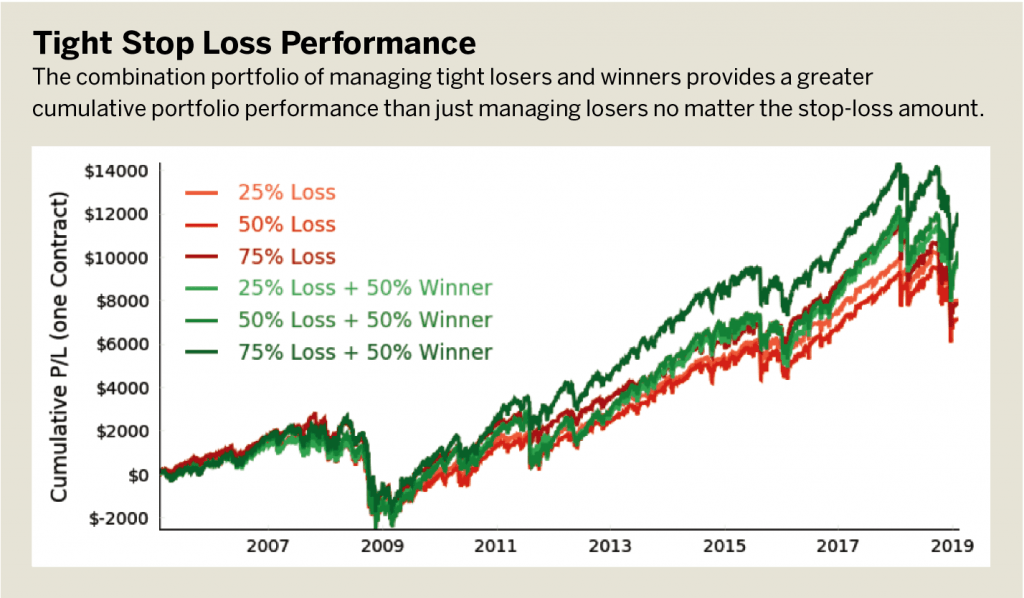
These performances can be evaluated by comparing the long-term portfolio performance of each strategy. This performance is evaluated by holding one contract continuously since 2005.
As seen in “Tight Stop Loss Performance,” below, the combination portfolio of managing tight losers and winners provides a greater cumulative portfolio performance than just managing losers, no matter the stop-loss amount.
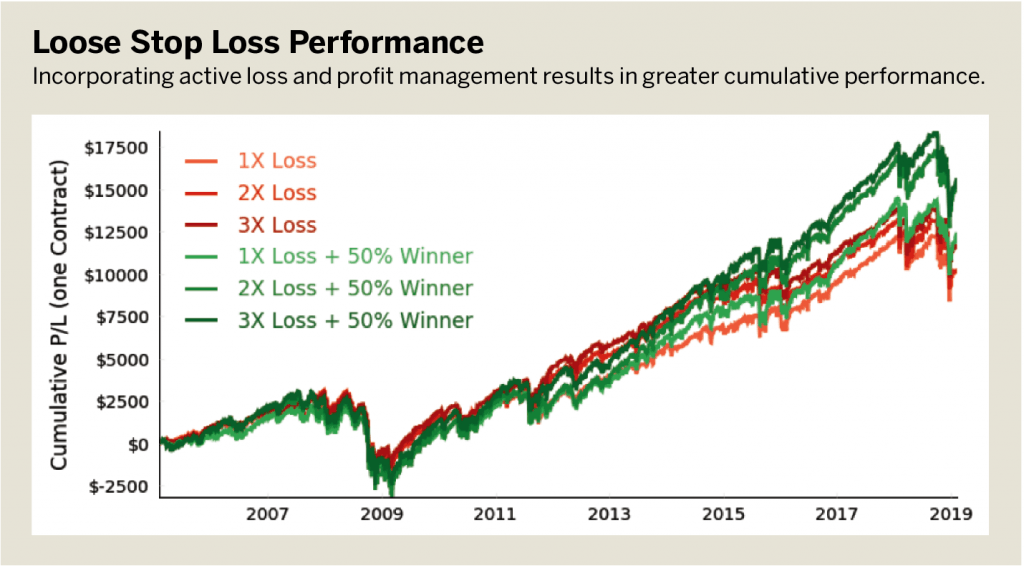
The same trend persists for loose stop losses; incorporating active loss and profit management results in greater cumulative performance. (See “Loose Stop-Loss Performance,” below.)
Adding a profit-taking component to stop losses results in consistently greater performance in the long run. Additionally, comparing the two types of stop losses, tight and loose, one sees that looser stop losses result in greater cumulative performance than their narrow counterparts.
Kai Zeng, an active derivatives trader for more than 10 years, works as a data scientist and derivatives strategist at tasytrade.