How to Trade the Surge in Market Volatility
Investors and traders looking to exploit the surge in market volatility might consider the options market, with a strategic emphasis on mean reversion.
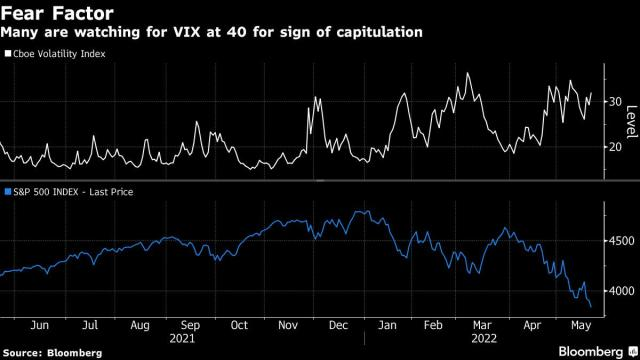
Volatility continues to reign in 2022, with the CBOE Volatility Index once against popping above 30 in mid-June.
Interestingly, however, the VIX still hasn’t managed to jump above 40, which is a big level to watch during H2 2022.
At present, there may be investors and traders who are new to the volatility space that are wondering how they can take advantage of the current trading environment.
And for that group, a new installment of Options Trading Concepts Live on the tastytrade financial network is highly recommended.
In this episode, the hosts provide more context on the definition of volatility and walk viewers through the volatility product landscape.
Trading options volatility using mean reversion
Two critical concepts to be familiar with in the options trading realm are volatility and mean reversion.
As it relates to equity derivatives, volatility can be defined as a measurement of how much the price of a financial instrument fluctuates over time—in this case, a stock.
While options are priced in dollars and cents in the marketplace, these values can be reverse-engineered to calculate a market value in volatility terms. The resulting calculation is called “implied volatility” and represents the market’s expectation for future movement in the price of a given underlying.
The volatility concept, as it relates to options trading, can be broken down into three distinct categories:
- Historical volatility
- Implied volatility
- Future volatility
Historical volatility is the easiest to understand of the three terms as it is observable. Every stock has a specific opening and closing price for each day it has traded. Therefore, a data scientist can compute the exact historical volatility (movement) of a stock over a defined period of time in history.
Implied volatility is the market price for volatility. One can look at the bid/ask of a particular option (symbol, strike and duration) and observe at what price trades are being executed. This value represents the current market price for volatility in an option, often called implied volatility.
Future volatility is the holy grail of options trading. Such a value involves estimating the future value of a stock, which is of course unknown. Hedge funds, banks, proprietary trading firms and the countless quantitative minds within them have spent innumerable sums of money trying to accurately—and consistently—forecast future volatility.
Obviously, the market players that most effectively estimate future volatility are likely some of the most profitable. However, as paradigm shifts can occur abruptly, there’s no telling how long those forecasts will be effective and over what time horizon.
It’s for this reason that mean reversion is such an important concept in volatility trading—especially for those without the resources to build comprehensive volatility forecasting tools.
In finance, mean reversion is the assumption that a financial instrument’s price will tend to move to the average price over time. If one applies that definition to the “price” of volatility, then it is the assumption that an option’s volatility price will tend to move toward its average over time.
Consequently, a mean reversion trade expresses the thesis that an asset has deviated too far from its real value—or at least from its mean price—and that opportunities for profit exist when reversion to the mean occurs.
For example, if the one-year historical volatility of stock XYZ is 20, and implied volatility for options with a one-year duration is priced at 30, an opportunity theoretically exists to sell that option with the expectation that actual volatility in the underlying over a one year period will be less than 30.
By no means does this mean profit in such a trade is 100% assured because future volatility is unknown. However, it has been observed that options prices are mean-reverting on average over time.
The tastyworks platform publishes volatility-focused data that volatility traders can leverage to assist with such decisions. One of the most important such metrics is implied volatility rank (aka IV Rank, or IVR).
IVR reports how the current level of implied volatility in a given underlying compares with the last 52 weeks of historical data.
For example, if implied volatility ranged between 30 and 60 during the last 52 weeks in hypothetical stock XYZ, and implied volatility is currently trading at 45, XYZ would have an IVR of 50%.
If implied volatility were currently trading 60 in XYZ, then the associated IVR would be 100%—indicating that implied volatility in XYZ was trading at the highest levels observed in the last 52 weeks.
Options and volatility traders use IVR to assess whether current levels of implied volatility are high (i.e., expensive) or low (i.e., cheap) and may help them decide how to deploy options/volatility trades.
High levels of implied volatility can signal that an opportunity exists to sell options/volatility, while extremely low levels of implied volatility can signal that an opportunity exists to buy options/volatility.
Generally speaking, short options/volatility trades become relatively more attractive when IVR is above 50%, whereas long options/volatility trades become relatively more attractive when IVR is below 50%.
It should be noted that due to the existence of “time decay” (aka “theta decay”), options/volatility traders often filter for even lower levels of IVR (20% and below) when buying options due to the fact that options naturally lose value as time passes.
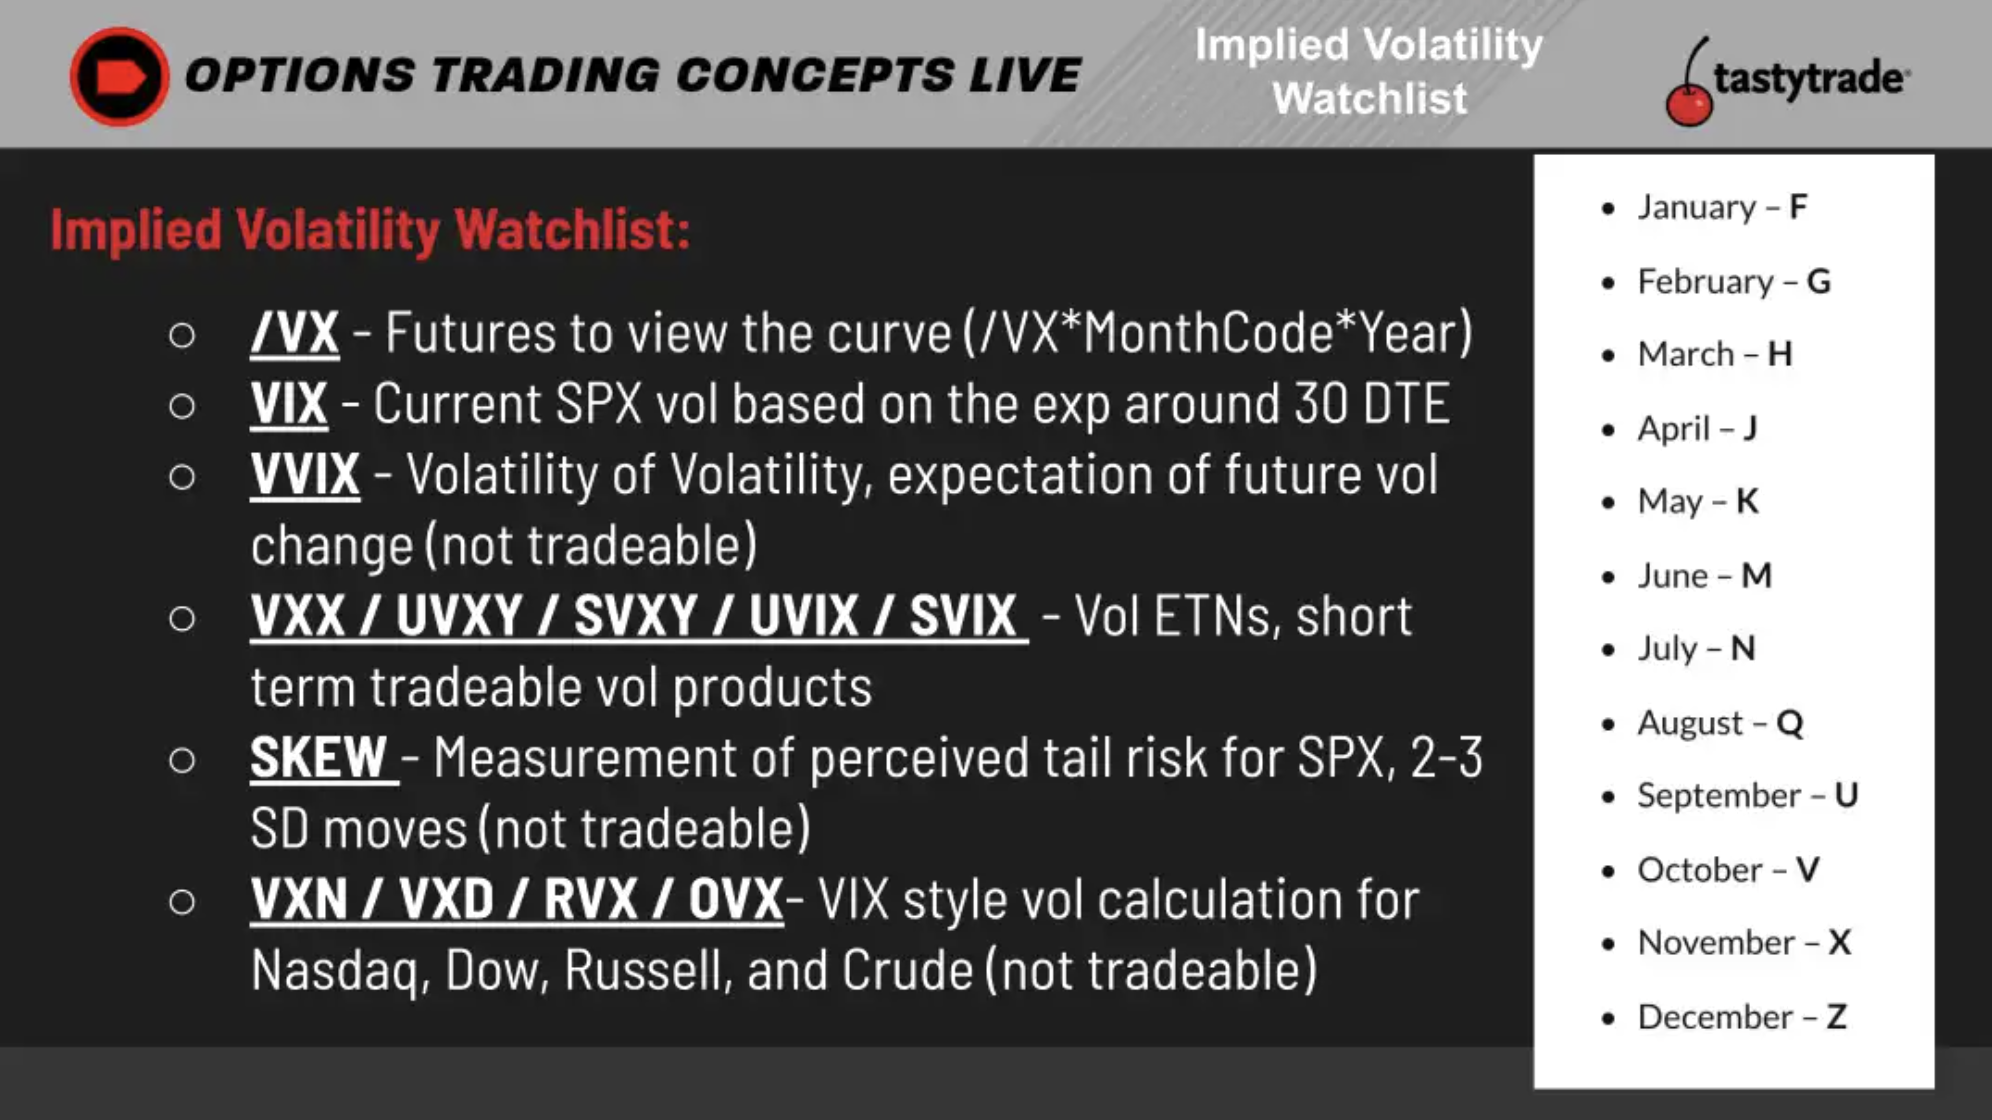
Volatility-focused financial instruments
While the CBOE Volatility Index (VIX) is the most widely reported metric for tracking daily changes in volatility, there are many other such products that traders can follow and trade.
One example is the S&P 500 Skew Index. The VIX is calculated using at-the-money (ATM) options in the S&P 500, whereas the Skew Index is calculated using out-of-the-money (OTM) options in the S&P 500.
As a result of this subtle difference, the Skew Index is typically viewed as a barometer of “tail risk” in the stock market.
Due to the complexity of some of these products, readers are encouraged to review the aforementioned episode of Options Trading Concepts Live for more information. For more context on volatility trading, this new episode of Today’s Assignment is also recommended.
To follow everything moving the markets this summer, readers can also tune into TASTYTRADE LIVE at their convenience.
Get Luckbox! Subscribe to receive 10-issues of Luckbox in print! See SUBSCRIBE or UPGRADE TO PRINT (upper right) for more info or visit getluckbox.com.
Sage Anderson is a pseudonym. He’s an experienced trader of equity derivatives and has managed volatility-based portfolios as a former prop trading firm employee. He’s not an employee of Luckbox, tastytrade or any affiliated companies. Readers can direct questions about this blog or other trading-related subjects, to support@luckboxmagazine.com.