Make History Work For You
Google provides historical stock prices traders can study or use to create a personalized portfolio tracker
Anyone with a Google account can easily download historical stock prices for free.
First, head to Google’s version of a spreadsheet, Google Sheets, and start a new document:
docs.google.com/spreadsheets.
In Cell A1, type the following and then hit “enter”:
=GOOGLEFINANCE (“SPY”, “all”, “2020-01-01”, “2020-10-09”, “daily”).
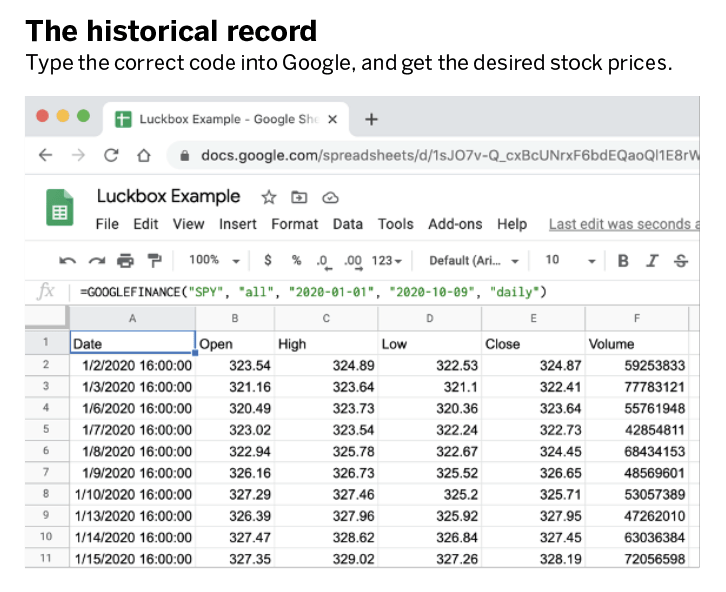
The daily OHLC (open, high, low and close) prices and volume for the symbol SPY from Jan. 1, 2020 to Oct. 9, 2020 will appear. See below:
To avoid manually posting start and ending dates and instead get the last month’s worth of data, use the command in Cell A1:
=GOOGLEFINANCE (“SPY”, “all”, edate(today(), -1), today(), “daily”).
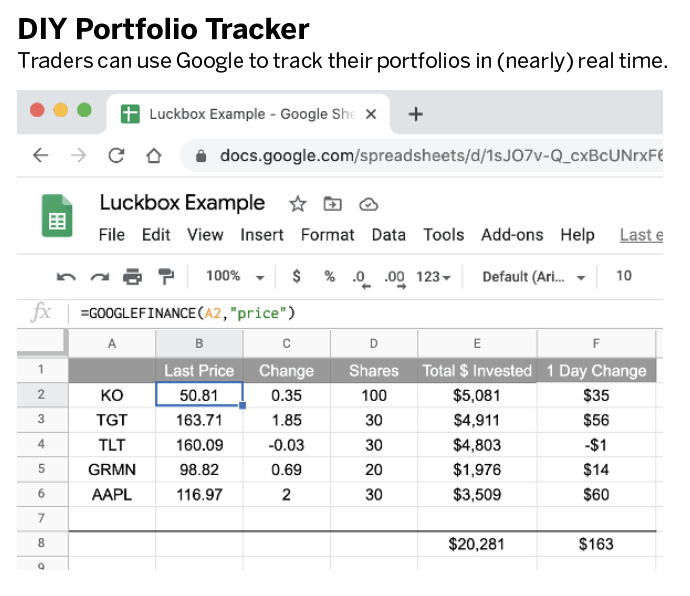
Traders can conduct studies with this historical data, and they can also create a personalized portfolio tracker in Google using real-time (or near real-time) prices.
Starting in Column A, create a header and then list the portfolio holdings. Next, in Cell B2, type:
=GOOGLEFINANCE (A2, “price”).
This will reference the symbol entered in column A2 and get the last price. To get the daily price change, in Cell C2, type:
=GOOGLEFINANCE (A2, “change”)
In Cell D2, type in the number of shares held. In Cell E2, multiply the last price by the shares held:
=B2 * D2.
Lastly, in Cell F2, multiply daily change of the symbol in Cell C2 by the number of shares held in D2:
= C2 * D2.
That creates a simple portfolio tracker, and traders can make multiple variations.
Click here to learn how to tackle losing trades.
Michael Rechenthin, Ph.D., aka “Dr. Data,” is the head of data science at tastytrade. @mrechenthin