Start Here: Calculating Volatility
With some (relatively) simple math, traders can track price moves in stocks and indexes
When a stock or index is down on the day, financial media and self-proclaimed market gurus describe it as “volatile,” even though that down move just brought the stock back to where it started before it rose.
“Experts” improperly use the label “volatile” to describe what traders call “two-sided price action.” It’s when the market goes up and down, instead of just up, up, up.
Yet they can’t quantify this movement. When presented a chart of Spotify (SPOT) and Sirius XM (SIRI), how many could say with conviction which is more volatile?
By applying some simple statistics, Luckbox readers can easily quantify volatility to aid their trading and decision-making.
One way to quantify risk is to look at the historical movement of a stock. Each stock has a different past price change, and that average price change, along with the dispersion around that average, provides a valuable measure of a stock’s volatility. Using data in the distribution of daily returns, traders can determine “normal” movement for a given stock and set expectations around future movement.
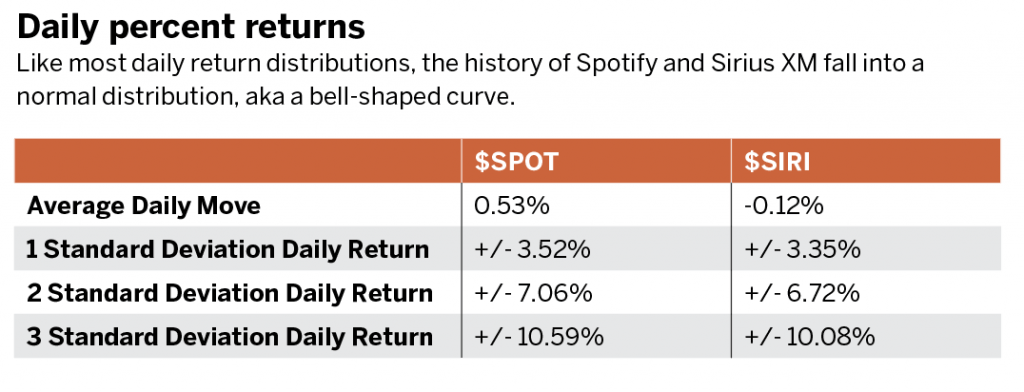
The starting point for measuring volatility is looking at the distribution of daily percent returns, as depicted for Spotify and Sirius XM in “Daily percent returns,” below. Like most daily return distributions, these fall into a normal distribution, or bell-shaped curve, with the average daily return centered around 0.00%.
In most observations, the daily change in the price of both stocks is small. However, large daily moves do occur in the shape of the distribution. Narrow distributions centered around the mean indicate a lower volatility, while wider distributions with long or fat tails indicate greater volatility.
Traders can use average daily returns and standard deviation, the amount of variation within the data, to quantify daily movement and volatility. Assuming the data is normally distributed, traders can use standard deviation to set probabilities around movement. Movements that fall within the one, two and three standard deviation ranges are expected to occur 68.3%, 99.5% and 99.7% of the time, respectively.
“Daily percent returns” displays the average daily move and standard deviations for Spotify and Sirius XM. Interpreting these results, a trader may say that 68.3% of the time Spotify will have a daily return between +/- 3.52%, while Sirius XM will have a daily return between +/- 3.35%.
In addition, 99.7% of the time daily returns will fall between +/- 10.59% and +/- 10.08%, respectively. The larger range of Spotify’s daily returns indicates that it’s more volatile than Sirius XM.
An investor looking to hold either stock for the long term may take that to mean Spotify is riskier than Sirius XM. A trader looking to make a few ticks on a short-term position may view Spotify as more opportune because it moves more.
Regardless of an individual’s goal, standard deviation can measure both risk and opportunity to provide a clear picture of possibilities.
Michael Gough enjoys retail trading and writing code. He works in business and product development at the Small Exchange, building index-based futures and professional partnerships. @small_exchange