The VIX Has Spiked—Time to Check Your IV

Longtime options traders are well aware of the link between realized (i.e. historical) volatility and implied volatility.
The former speaks to actual movement in a given underlying, whereas the latter speaks to the market price of expected movement.
Options traders who embrace the mean-reversion philosophy tend to refer to historical volatility when pricing volatility-based trades as a gauge of relative opportunity.
For example, if hypothetical stock XYZ has a historical volatility of 20%, then an options trader might be drawn to this underlying if implied volatility in XYZ is currently trading for 30%. In this example, an opportunity theoretically exists to sell XYZ volatility for 30%, with the expectation that it will move on a 20%, consequently producing a profit for the trader.
However, another important factor in this decision-making process involves an examination of the historical range in implied volatility.
For example, if implied volatility had ranged between 30% and 60% over the most recent 52 weeks of trading in XYZ, then selling 30% might seem relatively less attractive—if only because that’s the lowest level observed over the past year.
Due to the importance of second-level analysis such as this, the tastytrade financial network developed a metric known as implied volatility rank, or IVR, to provide traders with additional data to analyze potential trading opportunities in this manner.
As most are likely aware, Implied Volatility Rank provides insight on the current levels of implied volatility as compared to the last 52 weeks of data.
Using the same example, imagine that implied volatility in symbol XYZ is currently trading 30 and that over the last 52 weeks it has ranged between 30 and 60. In this case, IVR would be 0%, because 30 is the lowest level observed over that period. If implied volatility in XYZ were instead 45, then IV Rank would be 50%.
Traders often filter for opportunities to sell premium when IV Rank is above 50% and for opportunities to purchase premium when it’s below 50%.
Having said that, new research conducted by tastytrade indicates that after a significant spike in volatility, it may be necessary to rescale one’s expectations for IVR—particularly if a trader believes that the “main event” has passed, and that market volatility should decline in the coming weeks and months.
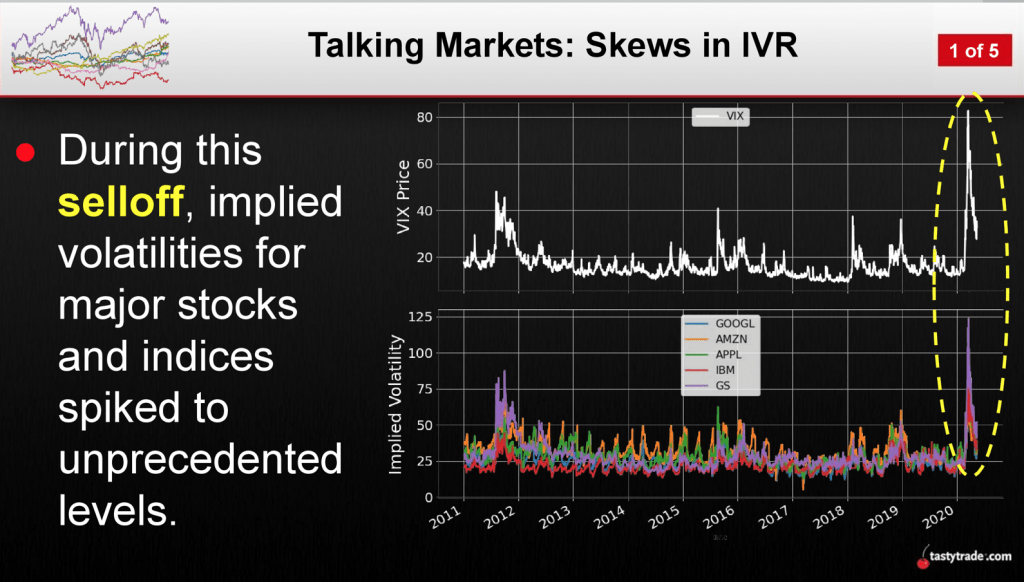
Adjusting one’s perspective like this may be necessary because after a big spike in volatility, IVR can become skewed. As shown in the chart below, implied volatility spiked to extreme levels during the recent coronavirus-related market correction:
The complication after the super spike in volatility is that these extreme levels will now be included in ongoing calculations of IVR.
For example, a symbol with a previous range of 30-60 in implied volatility might have seen the maximum balloon to 80 or 100 during the coronavirus correction. That means that the new threshold to sell premium (above 50% IVR) will have increased significantly.
Before the correction, 50% IVR in this underlying would have equated to an implied volatility of about 45. After the correction, 50% IVR would equate to something much higher—like 55 or 65.
In this scenario, if a trader views the “event” as a one-off occurrence, he or she might decide to rescale expectations for IVR accordingly. That could translate to a willingness to sell lower levels of IVR than before the event—depending on a given trader’s unique outlook and risk profile.
Traders seeking to learn more about this subject may want to review two new episodes on the tastytrade financial network that focus on this material.
The first episode, Tasty Extras, explains how IVR can become skewed after a significant market event. The second episode, Market Measures, explores historical market data to help traders better understand how they can “handicap” potential positions to account for extreme data points in their decision-making process.
Sage Anderson is a pseudonym. The contributor has an extensive background in trading equity derivatives and managing volatility-based portfolios as a former prop trading firm employee. The contributor is not an employee of luckbox, tastytrade or any affiliated companies. Readers can direct questions about any of the topics covered in this blog post, or any other trading-related subject, to support@luckboxmagazine.com.