Top 5 Strategies Every Day Trader Needs to Know
Day traders shoot for frequent gains in multiple positions across a spectrum of asset classes by utilizing strategies revolving around scalping, news, trends, mean reversion and money flows

This trading year has been extremely volatile, as illustrated by countless dramatic intraday moves across a diverse group of asset classes.
Choppy conditions aren’t necessarily ideal for traditional buy-and-hold investors, but an environment such as this usually receives a warm welcome from day traders.
When a position is opened and closed during the same day, that round trip is typically referred to as a day trade. Regular practitioners of this approach are commonly referred to as day traders.
Like moths to a flame, day traders are attracted to movement in the markets. But day traders also like to sleep well at night, which is why they focus on intraday positions and avoid overnight risk.
The aim of day trading is usually to make small, frequent gains across multiple positions that span the spectrum of asset classes.
Successful day traders are known for their mechanical approach to position management—relying on objectivity and discipline as opposed to emotion-based decision-making in the markets.
Positions deployed by day traders usually encompass the following financial instruments: stocks, ETFs, equity options, currencies (including cryptocurrencies), futures and options on futures. And the pool of strategies and market approaches used by day traders is even deeper.
However, the most prominent day trading approaches tend to revolve around scalping, news, trends, mean reversion and money flows.
Read on to learn more about each of these unique approaches, or jump straight over to the tastytrade day trading resource page.
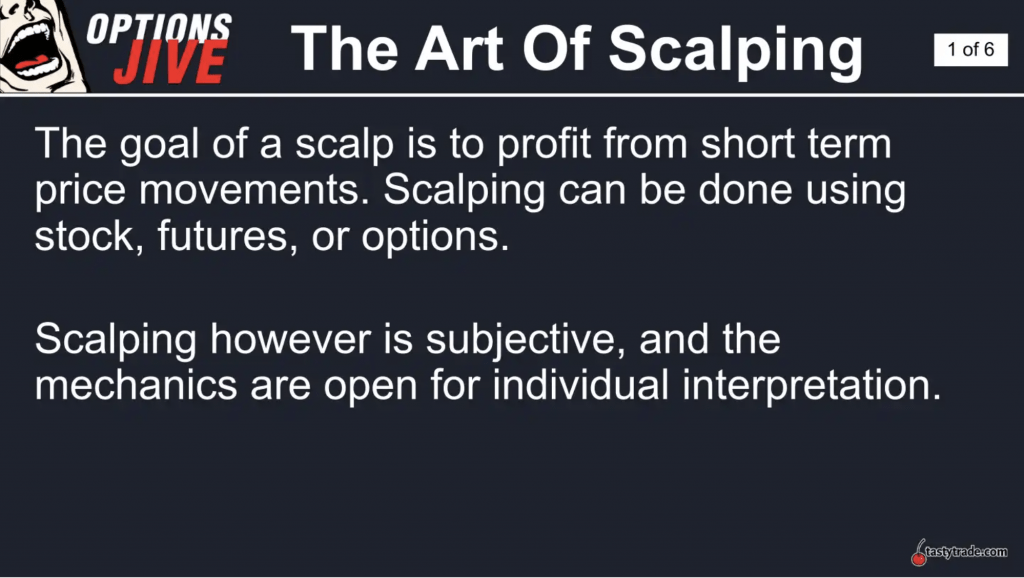
Strategy 1: Scalping
The scalping approach relies on market movement and profiting from that movement. Scalpers are generally seeking small gains on multiple trades.
Scalpers buy low and sell high, buy high and sell higher, short high and cover low, or short low and cover lower.
Decision-making associated with the scalping approach often boils down to technical analysis, but that’s not always the case.
Market participants who embrace technical analysis generally believe that short-term price movements are the result of supply and demand forces in the market. They use technical indicators such as price, volume and open interest to guide decision-making.
One critical aspect of scalping is that it usually involves an exit strategy. That means a position often has an associated maximum profit or maximum loss before deployment—thresholds at which a given scalp position would be closed. This is typically expressed using a stop-loss order.
A scalp could remain open for several seconds, several minutes or even several hours. Like all day trades, scalp positions are closed prior to the end of the trading day.
A scalper might place five to 10 trades a day, or several hundred trades a day—it varies based on the number of available opportunities and one’s unique appetite for risk.
Scalping is typically embraced by nimble traders who focus on precision timing and execution.
Scalpers often rely on momentum indicators such as stochastic, moving average convergence divergence (MACD) and the relative strength index (RSI). However, price chart indicators such as moving averages, Bollinger bands and pivot points may also be utilized as reference points for support and resistance levels.
Like all day trading approaches, scalping may require the associated account equity to be greater than the minimum $25,000 to avoid a pattern day trader (PDT) rule violation. In order to execute short-sale trades, the account must also be approved for the use of margin.
To learn more about scalping, readers can review this link.
Strategy 2: News Trading
Trading the news refers to a trading/investing approach that attempts to capitalize on planned news events or sudden, unexpected news developments.
For traders of the news, it doesn’t matter what market is making news. What matters is the potential for movement.
One of the keys to successfully trading the news is market awareness because this approach can’t be seamlessly executed without market context and the ability to act upon news developments in rapid fashion.
If sentiments are bullish due to good news, traders can go long. Conversely, if sentiments are bearish as a result of bad news, traders have the opportunity to go short.
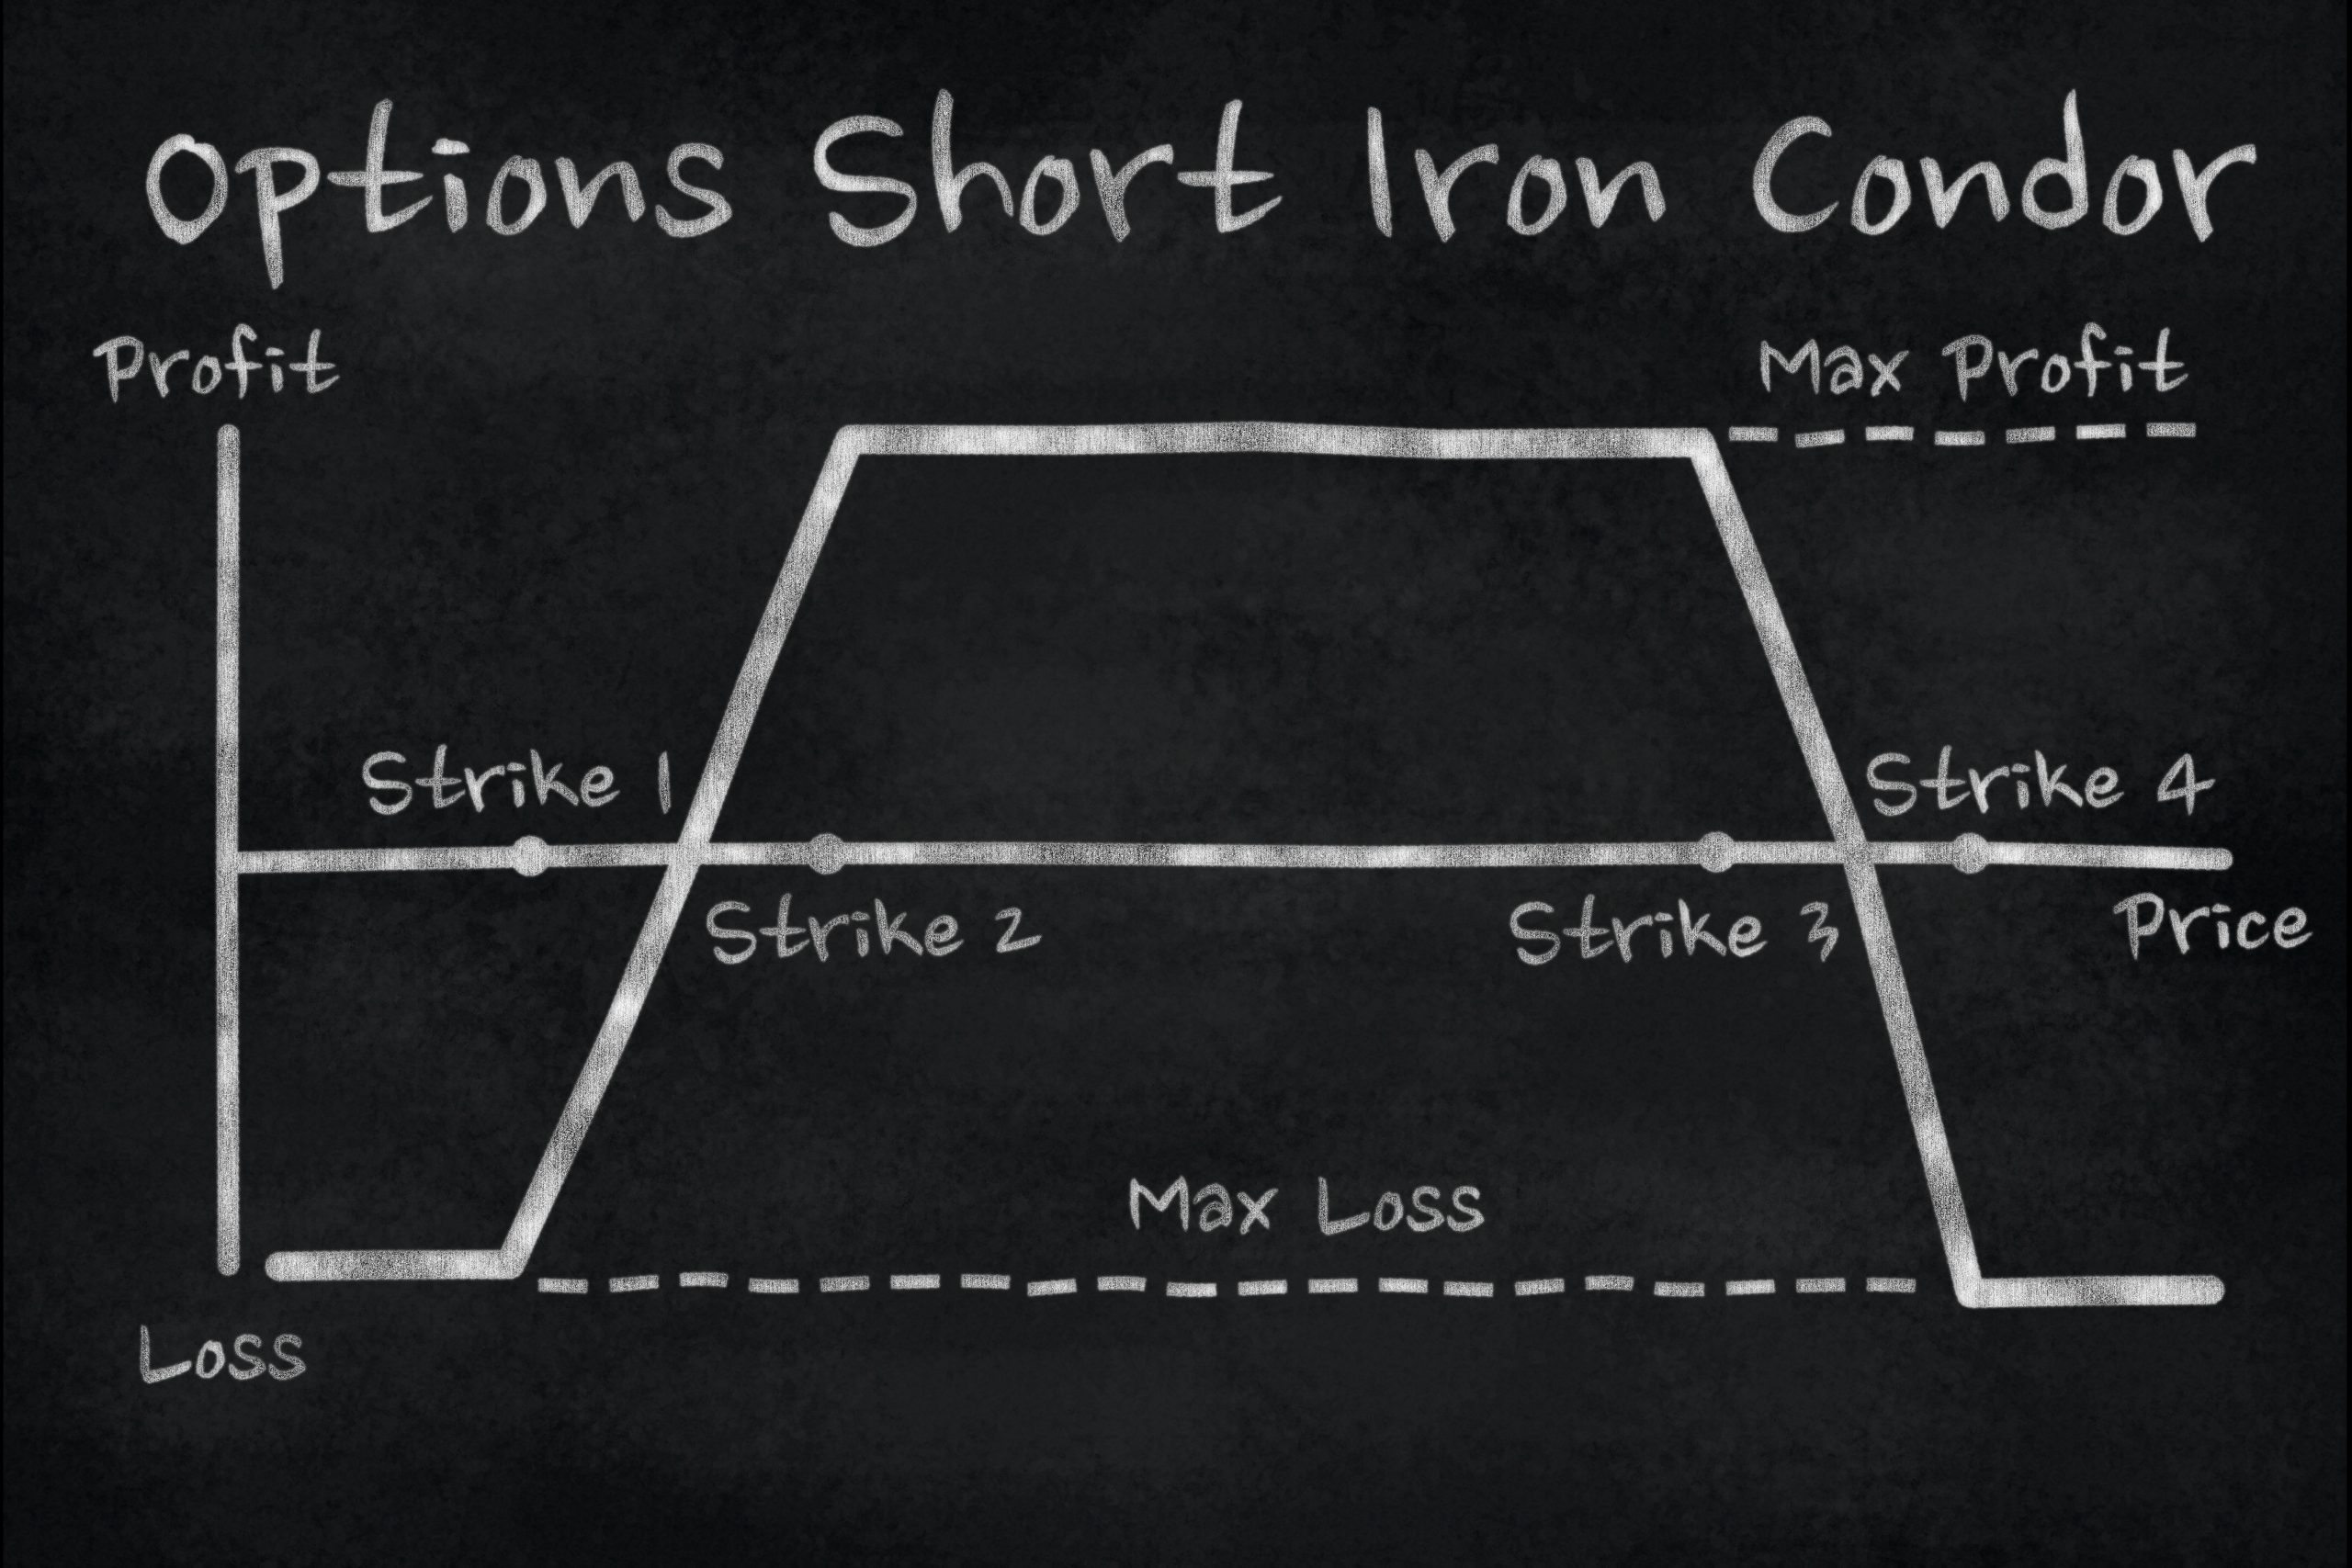
Much like scalping, a news-focused position might be expressed using a long or short position. However, news traders can also utilize volatility-focused trading strategies: selling volatility in the wake of impacting news, for example.
Opportunities for news-related trading have multiplied exponentially this century as a result of the internet, and more recently due to the increasing relevance of social media. Today, impacting news can hit the wires at literally any moment.
The earnings trade is one of the best-known segments within the broader news-trading strategy.
Corporate earnings are intimately linked with stock valuations because the price of a stock is often founded on earnings expectations or projections for a given company. Therefore, when companies release their quarterly earnings and ongoing financial projections, prices in the market usually fluctuate, sometimes significantly.
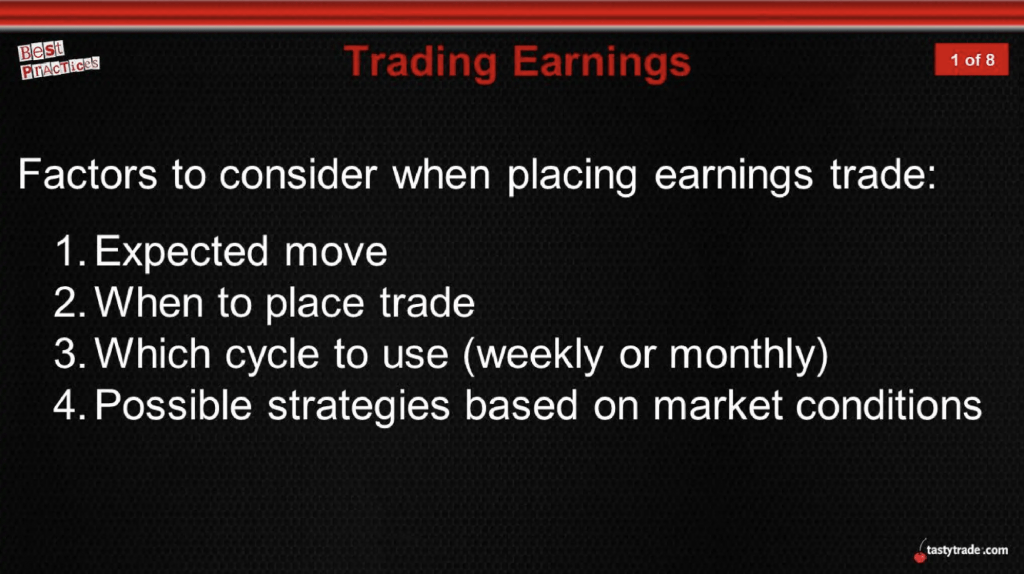
Readers seeking to learn more about the earnings trade are encouraged to review this installment of Best Practices on the tastytrade financial network.
Strategy 3: Trend Trading
Most market participants are well aware of the long-running market axiom “the trend is your friend.”
The trend-trading approach is the basis of that saying and refers to a trading style that attempts to capitalize on an asset’s momentum in a particular direction.
Trend traders put their faith in the assumption that the price of a given security will continue to move in the same direction it is currently trending.
Much like scalpers, trend traders often rely on momentum indicators such as stochastic, moving average convergence divergence (MACD) and the relative strength index (RSI).
Trend traders also tend to enter positions with a specific exit strategy. That means the trader has likely defined an associated maximum profit or maximum loss for a trade before deploying the position.
Moving averages may also be utilized by trend traders to help identify when there’s a shift in the trend.
Moving averages—couched within the technical analysis philosophy of investing/trading—are viewed as helpful in analyzing longer-term trends in a single stock, a stock index or pretty much any other tradable asset that can be viewed on a price chart.
In the most basic terms, a simple moving average (SMA) calculates an asset’s average closing price over a set window of time. SMAs typically appear as a line on a price chart and can help investors and traders identify emerging trends.
The 200-day moving average in the S&P 500 is one of the most-followed SMAs and is calculated by adding the closing prices of the last 200 sessions for the S&P 500 and dividing that sum by 200—then repeating the next day and so on.
In general, when an underlying remains above its 200-day moving average, that’s viewed as constructive, and the continuation of an uptrend. But when the price of security dips below its 200-day moving average, that’s sometimes viewed as breaching an important support level.
Some market participants use moving averages beyond the 200-day. For example, many technical analysts monitor the 200-day SMA in tandem with the 50-day SMA.
When the 50-day SMA crosses to the downside of the 200-day SMA, that is commonly referred to as a “death cross.” Such moves can—but not always—signal a bear market in a stock, index or any other asset that’s viewed on a price chart.
To learn more about tastytrade’s research on moving averages, readers are encouraged to review this installment of Market Measures.
Strategy 4: Mean Reversion
In the financial markets, mean reversion describes the tendency of asset prices to move toward their average over time.
A mean reversion-based trade therefore expresses the belief that an asset has deviated too far from its real value—or at least from its mean price—and that opportunities for profit exist when reversion to the mean occurs.
Contrarians, whether they consciously accept it or not, are essentially practitioners of the mean reversion trading philosophy. Option securities have consistently demonstrated a tendency to mean revert, which suggests that volatility traders in the options space are basically contrarians as well.
However, the mean reversion approach can be applied to a wide range of securities, and can be utilized as a day trading strategy.
Under this approach, decisions are made based on extreme moves in the price of an asset or security. So, if a price is observed to have sharply corrected, a day trader might take a contrarian view and deploy a long position intended to profit from a rebound in price—a reversion toward the mean price.
Alternatively, one might take a short view on a price that had rallied in extreme fashion. The intent with this position would be to profit from a potential retracement in the price as the underlying reverts downward toward its mean.
The return to a normal pattern is, of course, not guaranteed because unexpected highs or lows could also indicate that a permanent shift has occurred.
Notably, mean reversion can also be applied to pairs trading.
In this case, the approach hinges on the existence of a long-term, established relationship between two securities or assets. When the pair deviates from their typical historical pattern, traders can theoretically deploy a trade structure that benefits from a reversion back to that typical trend.
For example, gold and silver share a well-known positive correlation that hovers historically around 0.89. The gold-silver pair is so famous that it even has its own ratio named after it: the Gold-Silver Ratio.
This ratio is computed by taking the price per ounce of gold and dividing it by the price per ounce of silver, the result of which reports how many ounces of silver are required to purchase an ounce of gold. Because the Gold-Silver Ratio can be tracked over time, traders can identify extremes in the ratio and attempt to profit from reversions to the mean.
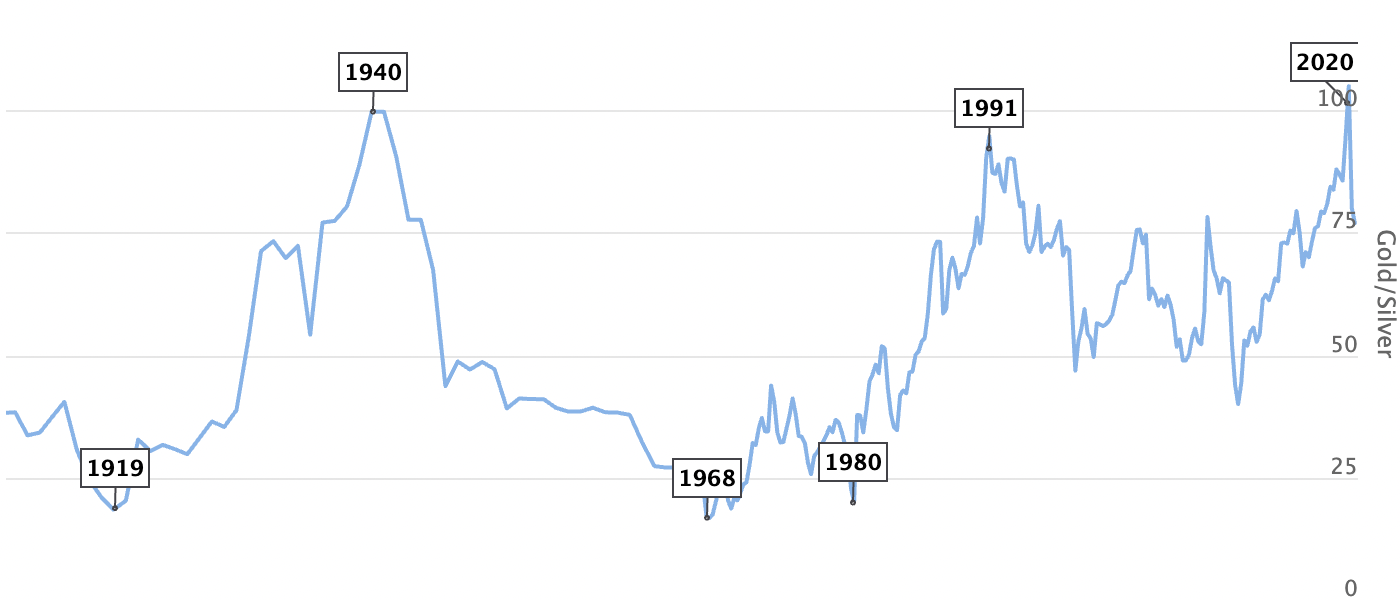
As illustrated above, the Gold-Silver Ratio has traded between roughly 40 and 110 over the last 30 years, and the recent mean in the metric is about 67.
When the ratio is at the lower end of the historical range, pairs traders consider buying gold and selling silver in hopes that the ratio will rise. Alternatively, pairs traders sell gold and buy silver when the ratio hits the upper end of its historical range—a position that theoretically benefits from a decline in the Gold-Silver Ratio.
One can see from the gold/silver example that identifying and deploying an attractive mean-reverting pair depends on identifying a pair with a long-established relationship and tracking when that relationship (i.e. correlation) breaks down.
Readers looking to learn more about the mean reversion trading approach using pairs are encouraged to review this previous installment of Market Measures.
Strategy 5: Money Flows
The money flow trading strategy is based on the money flow index (MFI), a technical indicator that shows whether an asset is currently overbought or oversold. Instead of looking at price alone, the money flow indicator incorporates a volume consideration too.
The MFI is usually interpreted in a similar way to the Relative Strength Index (RSI). The big difference between the two is that the MFI incorporates volume. Because of this, the MFI tends to act a bit differently with the RSI because volume leads prices.
The indicator signals an asset as overbought with a reading of at least 80—traders using the money flow strategy will sell in this case. On the other hand, an oversold market condition is reflected by a reading of 20 and below, a signal to buy.
However, much like mean reversion trading, there’s no guarantee that a reversal will occur. During periods of strong upward or downward trends, markets can remain at overbought/oversold levels for days, weeks or months.
This reality follows another famous market axiom that “the markets can stay irrational longer than one can remain solvent.”
That’s why many day traders who utilize the money flow approach often supplement it with other indicators such as the RSI and Fibonacci Retracement—data that can help reinforce the validity of a potential trading signal.
Rules and Additional Resources
Before embarking on a day trading-orientated endeavor, investors and traders should familiarize themselves with associated rules and regulations.
While cash account rules are based on Good Faith Violations (GFV), margin accounts are subject to Pattern Day Trading (PDT) rules. For margin accounts, these include:
- PDT applies to you if you perform over three trades in a rolling five-business-day period
- You need to have a minimum of $25,000 in your account before starting to day trade on any given day
- PDT rules don’t apply to futures trading or crypto trading, but both can affect whether your account meets the net liquidation requirements for PDT rules
More information on Pattern Day Trading rules is available via this link. Information on Good Faith Violations is available via this link. To learn more about the aforementioned day trading approaches and strategies, this link is also recommended.
For updates on everything moving the markets, readers can tune into TASTYTRADE LIVE weekdays from 7 a.m. to 4 p.m. Central Time at their convenience.
Get Luckbox! Subscribe to receive 10-issues of Luckbox in print! See SUBSCRIBE or UPGRADE TO PRINT (upper right) for more info or visit getluckbox.com.
Sage Anderson is a pseudonym. He’s an experienced trader of equity derivatives and has managed volatility-based portfolios as a former prop trading firm employee. He’s not an employee of Luckbox, tastytrade or any affiliated companies. Readers can direct questions about this blog or other trading-related subjects, to support@luckboxmagazine.com.