Trading a Mean-Reverting ‘Volatility Crush’
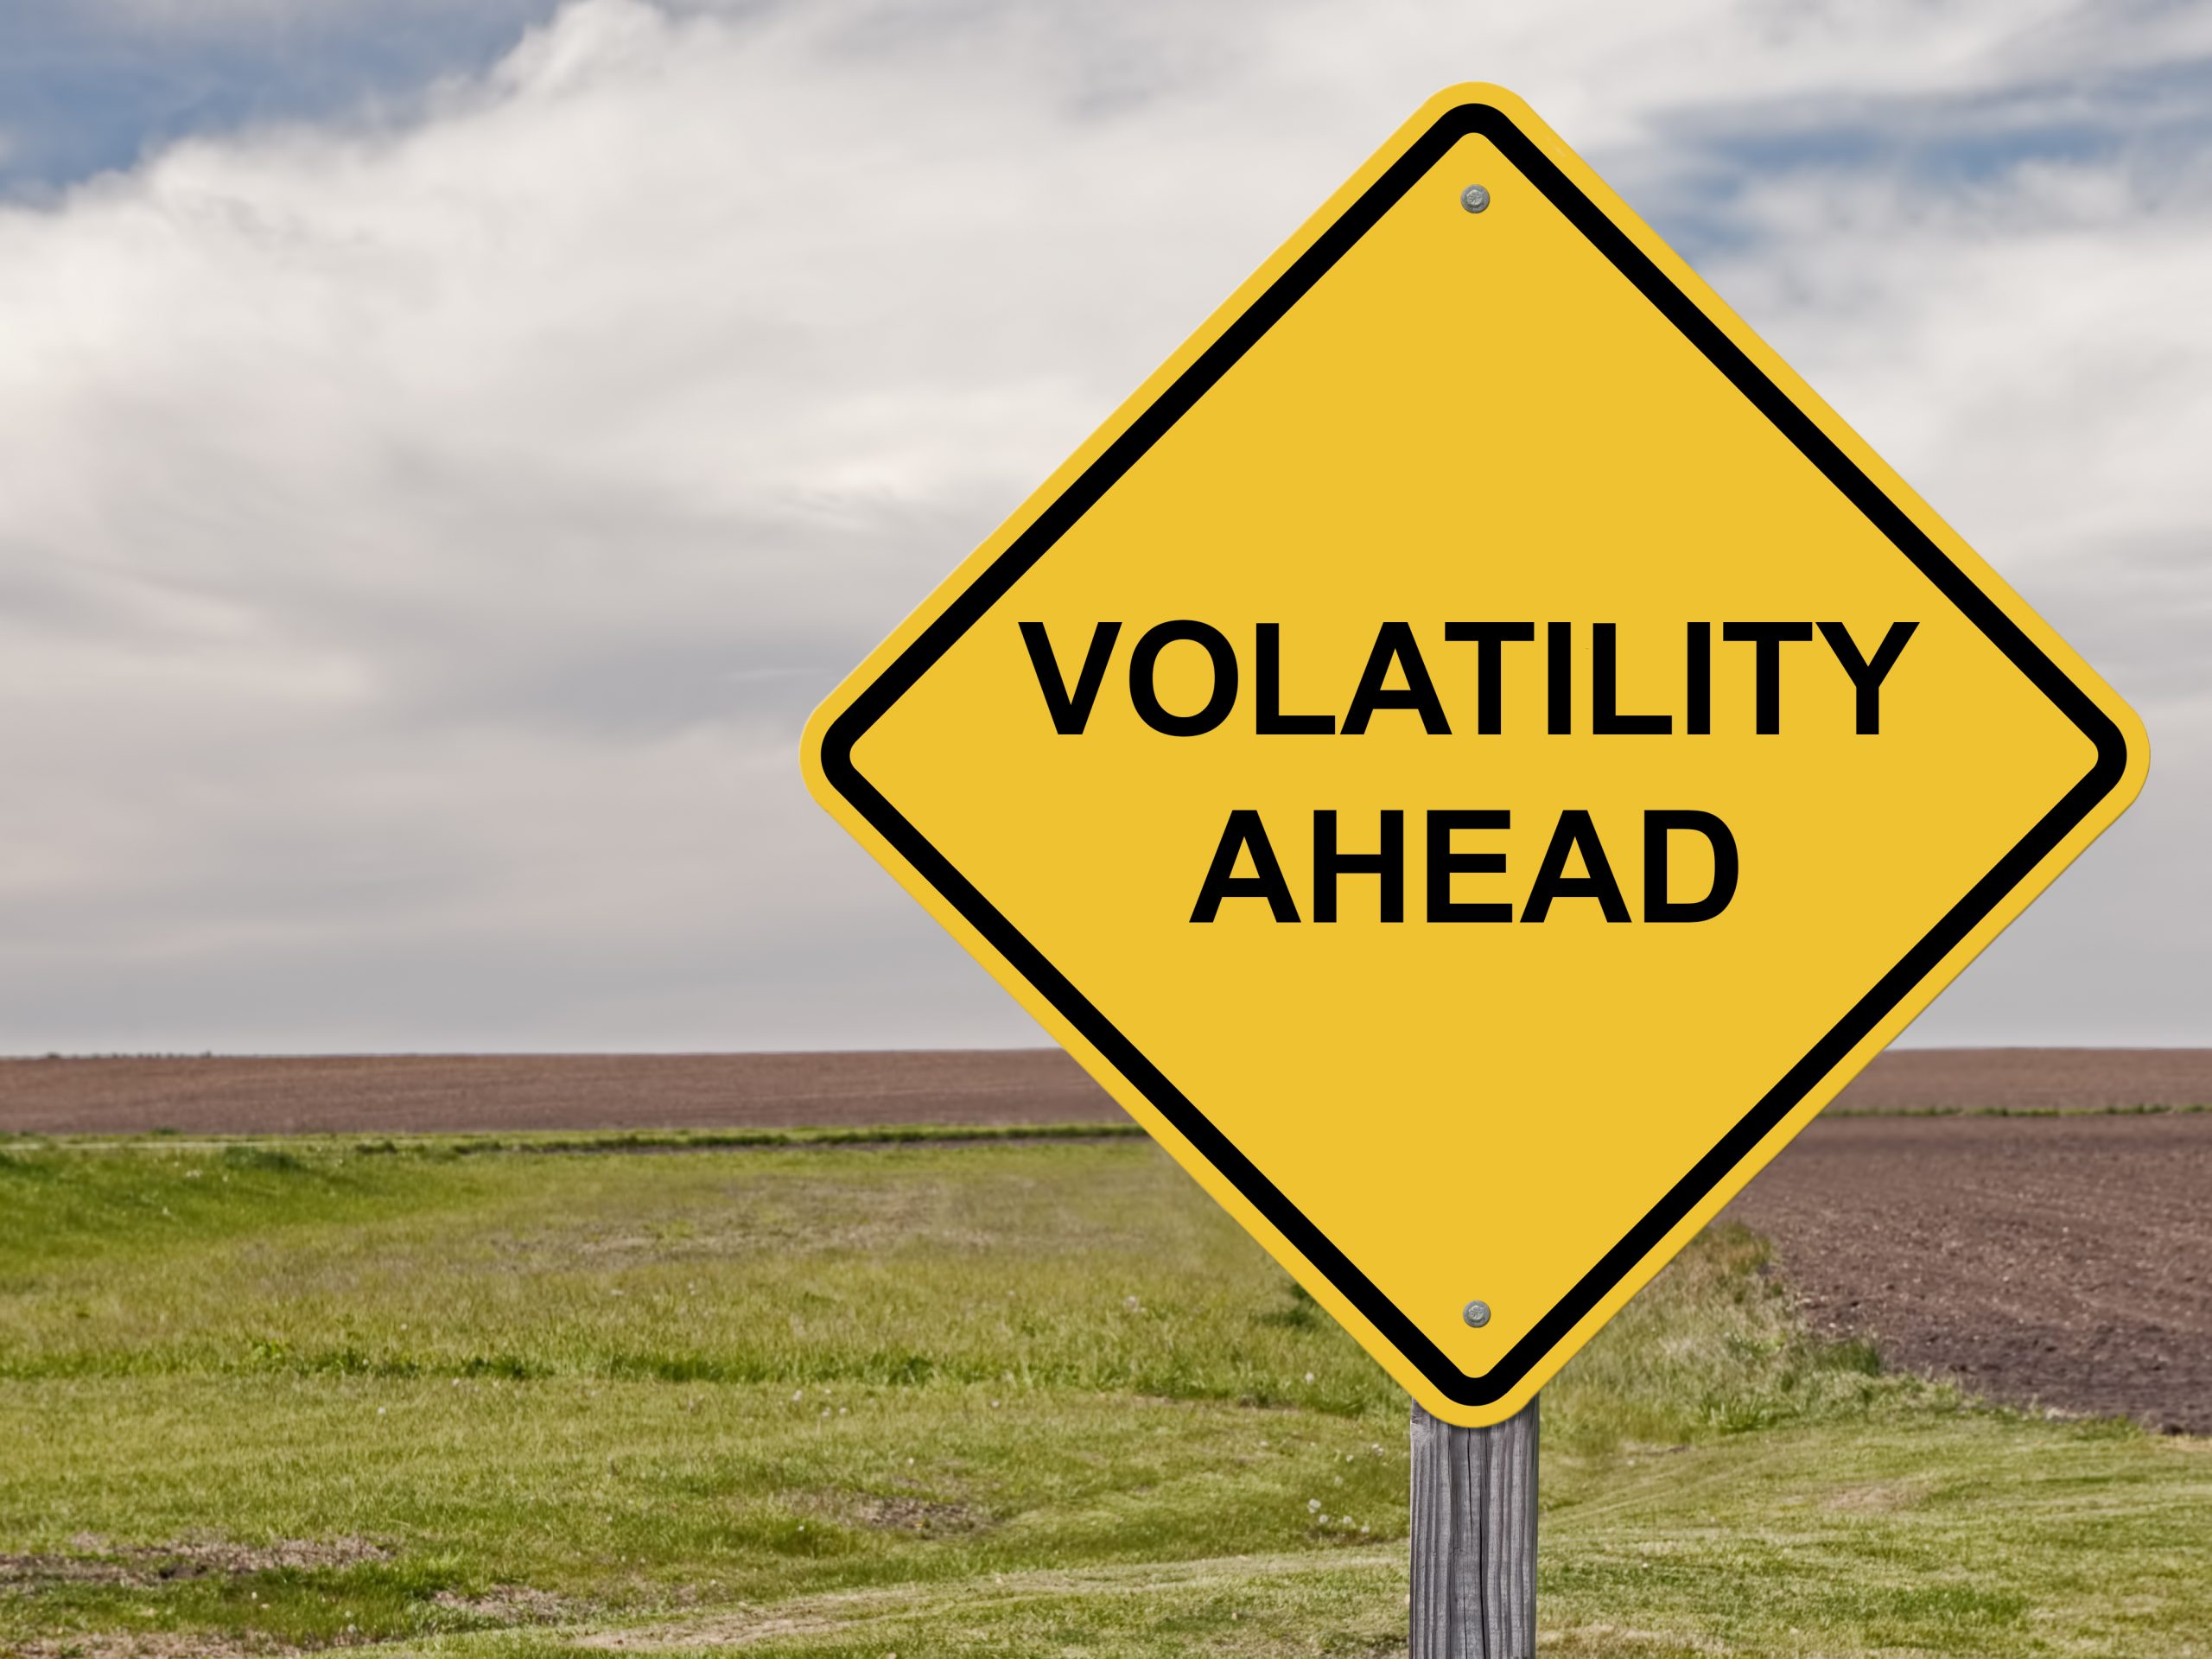
A “volatility crush” can materialize in the wake of a company’s earnings, or after a particularly chaotic period of trading in the stock market.

“Volatility crush” in the options trading universe generally refers to a collapse in the value of an option. Most often, investors and traders refer to a so-called “vol crush” in the wake of a company’s earnings or when stability returns to a chaotic market.
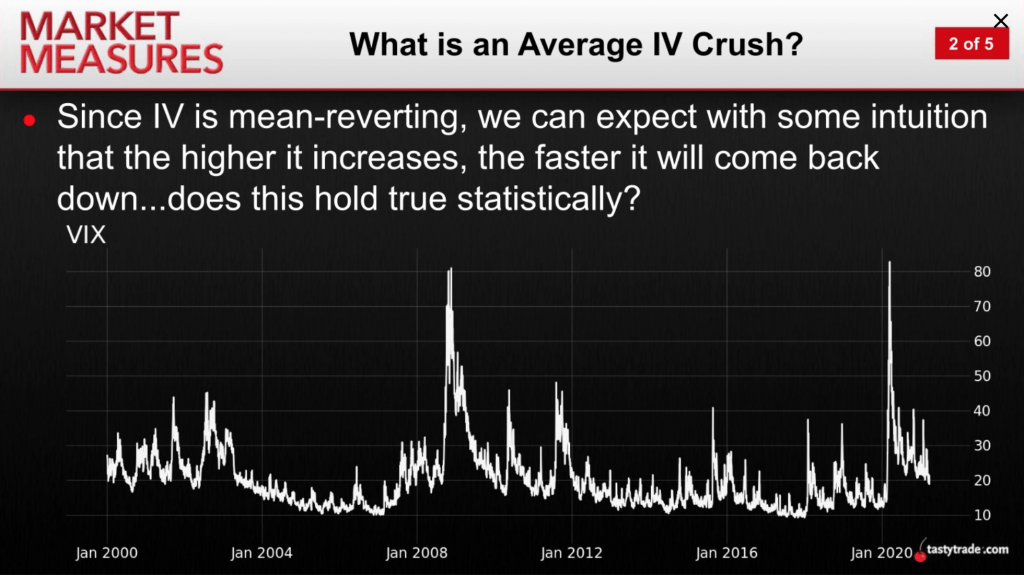
For example, after global stock markets endured a sharp correction last spring, volatility spiked to all-time highs, as measured by the CBOE Volatility Index (VIX). But over the ensuing months, volatility contracted heavily, ultimately rewarding short volatility players.
At their core, contractions and expansions in volatility illustrate the mean-reverting nature of “fear” in the financial markets. When fear is peaking, volatility expands and options prices (i.e. market insurance) rise. On the other hand, when complacency takes over and volatility dips, options prices tend to deflate.
In technical terms, mean-reversion is underpinned by the tendency of volatility to move toward its historical average over time.
Consequently, a mean reversion trade expresses the thesis that an asset has deviated too far from its real value—or at least from its mean price—and that opportunities for profit exist when reversion to the mean occurs.
By no means does this mean that every volatility is guaranteed to be profitable, because future volatility is ultimately unknown. However, due to the mean-reverting nature of volatility, research has established that the probability of success for volatility trades increases when volatility has deviated further from its mean, as shown below.
But how can one estimate the degree to which volatility will mean revert, and the expected timeline of the mean reversion process?
New research conducted by tastytrade helps answer these questions and provides investors and traders with more insight into the mean reversion timetable—particularly as it relates to marketwide spikes in “fear” (i.e. the VIX).
In order to study the tendencies of volatility contractions, the tastytrade network conducted a series of comprehensive backtests using historical data in the VIX. The goal was to establish how long it took for the VIX to contract by 20% once it surpassed a certain threshold.
For example, how long has it taken historically for the VIX to contract by 20% after it has risen above 60, and how long has it taken to contract by 20% after it has risen above 50?
The chart below provides a snapshot of the aforementioned research and illustrates how long it has taken for volatility to contract, on average, once it has surpassed a designated threshold.
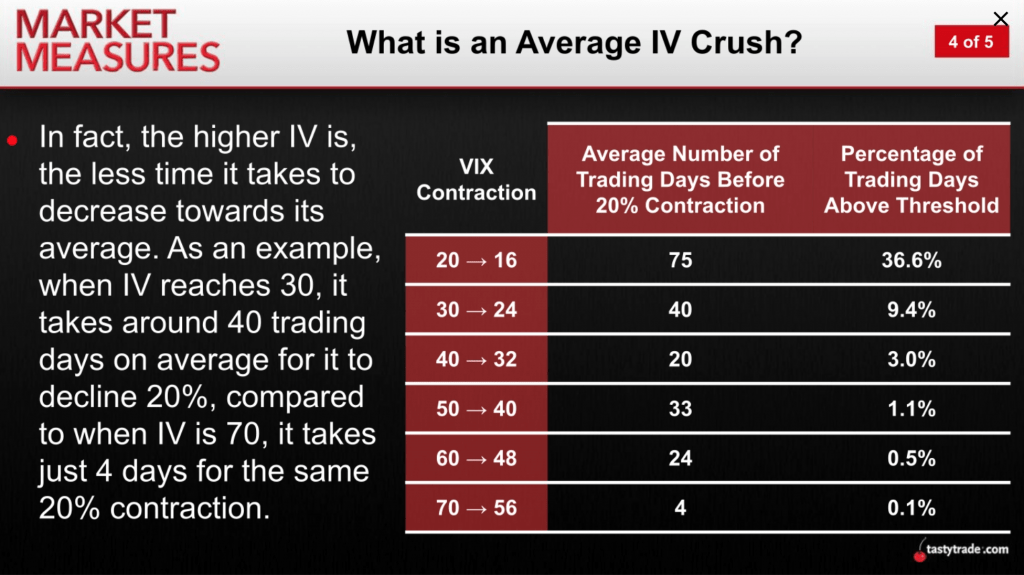
As one can see in the above data, the VIX has historically tended to contract quickly from extreme highs (>60), but the rate of contraction tends to slow considerably as the VIX gets closer to its historical mean (19).
For example, when dropping from 70 to 56, the VIX has, on average, required four trading days to do so. But when dropping from 20 to 16, the average number of elapsed trading days jumps to 75.
The above underscores the importance of volatility spikes in the marketplace, and why so many investors and traders view these occurrences as potential opportunities. Likewise, this also helps explain why traders utilize other tactics (like extending trade duration) in low-volatility environments.
To learn more about adapting one’s volatility approach to different trading environments, readers are encouraged to review a new episode of Options Jive when timing allows.
And while the VIX is a great metric to follow, market participants aren’t limited to this product as the only source of information when it comes to identifying potential trading opportunities.
Another great metric to monitor is Implied Volatility Rank (aka IVR), which provides specific insight into a given underlying. Implied Volatility Rank reports whether implied volatility in a given underlying is currently high, low or neutral as compared to the last 52 weeks.
For example, if hypothetical stock XYZ has had an implied volatility between 30 and 60 over the past year and implied volatility is currently at 45, XYZ would have an IVR of 50%. And if implied volatility increased to 60 in XYZ, then its IVR would be 100%.
When IVR is above 50%, volatility traders often filter for opportunities to sell volatility (i.e. sell options), while IVRs below 50% may present potential opportunities to buy volatility.
Implied Volatility Rank simply helps illustrate how current levels of implied volatility compare with recent history.
To learn more about the above topics, readers may want to review the following tastytrade programming when scheduling allows:
- Market Measures: What is Average IV Crush?
- Options Jive: Adjusting Volatility Trades by Market Environment
- Market Measures: More Context on Implied Volatility Rank
- Market Mindset: Earnings Volatility Crush
Sage Anderson is a pseudonym. He’s an experienced trader of equity derivatives and has managed volatility-based portfolios as a former prop trading firm employee. He’s not an employee of Luckbox, tastytrade or any affiliated companies. Readers can direct questions about this blog or other trading-related subjects, to support@luckboxmagazine.com.