Trending Together
Many stocks tend to move in tandem, so pairs trading enables investors to mitigate directional exposure
Investors might consider using pairs trading when they feel bullish or bearish on a stock but want to reduce exposure to the daily movement within the market. In other words, it’s well known that stocks tend to move in tandem—they tend to go up or down in price at the same time. Pairs trading enables investors to be more non-directional and make money on the relative value of the investment—making money in up and down markets.
For example, an investor might think Caterpillar (CAT) is undervalued compared to the overall market. While Caterpillar is up a few percentage points over the past year, the Dow Jones (DIA) is up 15% over the same period. In this case, the investor might go long Caterpillar and sell an equal dollar amount of DIA. That’s a strategy that professional traders have been using for years, and usually these trades take a few days to a few weeks to play out. Occasionally, investors keep these trades for a few months.
With the price of DIA more than twice the price of CAT, traders would need half the shares of DIA to gain a hedge—for example, 134/294 = 0.46. But another more advanced way of trading stocks and exchange-traded funds (ETFs) incorporates the different magnitudes of movements into the ratios. It’s called “volatility-based pairs trading.”
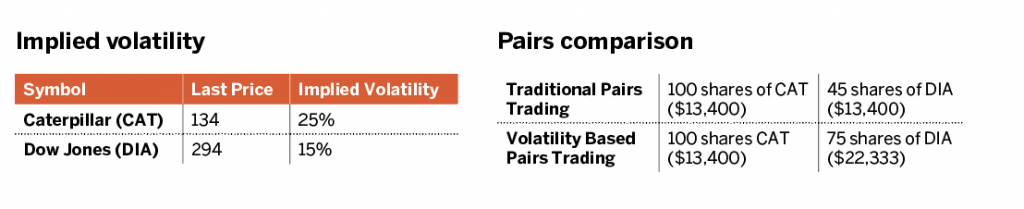
To use “volatility-based pairs trading,” investors need two numbers for each symbol: price and implied volatility. Implied volatility can be captured from an advanced trading platform such as tastyworks. (See “Implied volatility,” below.)
Notice the one-year percentage change of CAT and DIA in “Tracking volatility,” below. CAT is considerably more volatile than DIA. That means the hedge needed to reduce risk will be greater than just looking at price.
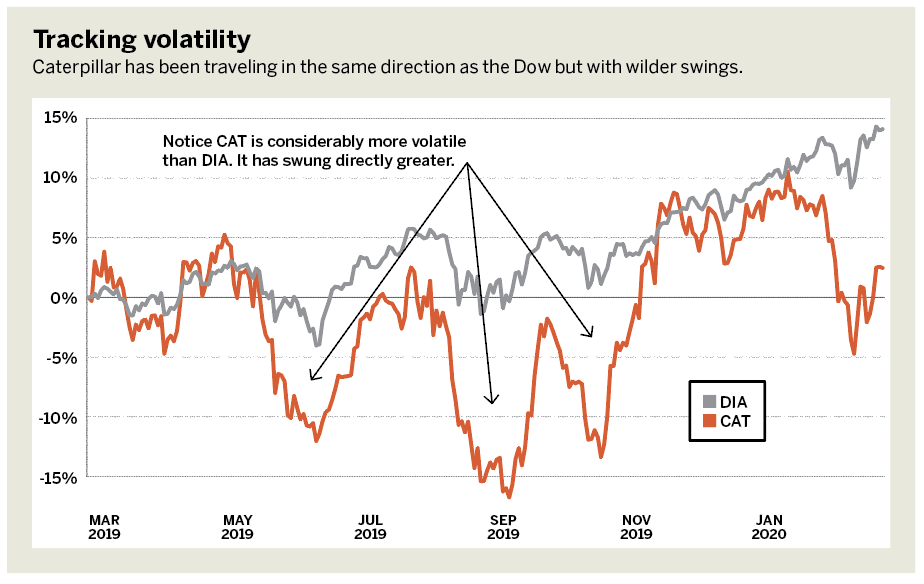
Caterpillar, as a percentage, has a much larger expectation of movement because it has a larger volatility than the Dow—nearly double. But the price of Dow Jones is more than double the price of Caterpillar. Follow the steps below to determine how many shares of the hedge are needed.
First, multiply the symbol by the last price and then by the implied volatility. That provides a theoretical expected move of the price over one year—either up or down. Thus, Caterpillar is expected to move by 134 x 25% = 33.5, either up or down over one year. While the Dow is expected to move by 294 x 15% = 44.1, either up or down over one year.
Second, divide the amount that Caterpillar is expected to move by the amount that the Dow is expected to move. Thus, 33.5 / 44.1 = 0.75. That means investors need three-quarters as many shares of the Dow (compared to Caterpillar) as opposed to only half if investors didn’t take volatility into consideration. The pairs trading ratio differences are even more dramatic when the change between the volatilities are larger. (See “Pairs comparison,” below.)
So, adjusting for volatility means that an investor has a more appropriate hedge for risk. That helps lower daily change in price between the pairs. It’s something to consider when trading two symbols.
Michael Rechenthin, Ph.D., (aka “Dr. Data”) heads research and data science at tastytrade. @mrechenthin