VVIX/VIX Ratio Suggests Risks to the Everything Rally are Rising
With the VVIX/VIX ratio currently surging, it’s worth noting that this precise development has at times previously predicated corrections in the stock market.

Currently trading about 18, the CBOE Volatility Index (VIX) isn’t exactly flashing red at the present time.
But another metric involving the VIX appears to be trending toward an extreme, and as a result, should be on the radar of investors and traders in the coming weeks.
The metric in question involves the CBOE VIX Volatility Index (VVIX), which is often referred to as the “VIX of VIX.”
As most are well aware, the VIX is calculated using the implied volatility of options in the S&P 500. As implied volatility rises in S&P 500 options, so too does the VIX.
Alternatively, the VVIX is calculated using the implied volatility of options in the VIX itself. So as implied volatility rises in the VIX, so does the VVIX. That is why the VVIX is said to be the “VIX of VIX,” measuring the “volatility of volatility,” or “vol of vol.”

Practically speaking, the VIX gauges risk premium in S&P 500 options, whereas the VVIX gauges the risk premium in VIX options. Consequently, VVIX allows for further insight into the current risk dynamic.
For context, the long-term average in the VIX is around 19, while the long-term average in the VVIX is about 88. In spring of 2020, when the stock market dropped precipitously, the VIX set a new all-time closing high above 82 on March 16. On that same day, the VVIX spiked above 200, also setting a new all-time closing high.
Market participants often use the ever-changing relationship between VVIX and VIX to monitor the market’s prevailing risk dynamic through a metric known as the “VVIX/VIX ratio.”
Historically, the VVIX/VIX ratio tends to be lower during periods of extreme volatility and higher during periods of relative complacency. For example, during that sharp correction in March of 2020, the VVIX over VIX ratio dipped as low as 2.5 (207/82 = 2.5).
In comparison, on October 5, 2017, the VIX posted one of its lowest closing prices of all time at 9.19—a clear indication of market complacency. On that same day the VVIX closed trading just over 91—meaning the VVIX/VIX ratio at the close of trading on October 5, 2017 was almost 10.
In recent years, that means the VVIX/VIX ratio has ranged between roughly 2.5 (when market volatility was peaking) and almost 10 (when market volatility was complacent).
As of today, the VVIX/VIX ratio stands at around XYZ (118/17 = 6.9), meaning risk in the financial markets might be higher than most might think, despite a relatively benign (i.e. complacent) reading in the regular VIX.
The chart below highlights the historical VVIX/VIX ratio and provides insight into previous instances in which the metric hit the upper end of its range.
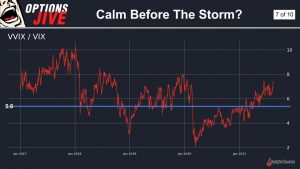
As one can in the above data, previous spikes in the VVIX/VIX ratio have often corresponded with selloffs in the broad market indices—including in 2018 and 2020.
While this development doesn’t alone guarantee that a significant correction is around the corner, it does provide further insight into the current risk dynamic on Wall Street. Especially when one considers that other well-known metrics—such as the Buffett Indicator—are also trading at extremes.
Readers seeking to learn more about ongoing risks to the current “everything rally” are encouraged to review a new installment of Options Jive on the tastytrade financial network. More information on the VVIX is also available via this link.
For updates on everything moving the markets, readers can tune into TASTYTRADE LIVE—weekdays from 7 a.m. to 4 p.m. CST—at their convenience.
Sage Anderson is a pseudonym. He’s an experienced trader of equity derivatives and has managed volatility-based portfolios as a former prop trading firm employee. He’s not an employee of Luckbox, tastytrade or any affiliated companies. Readers can direct questions about this blog or other trading-related subjects, to support@luckboxmagazine.com.