Your Thinking Must be Skewed
It’s said with good authority that volatility “skew” was born Oct. 19, 1987, when the magnitude of the market drop on Black Monday indicated all those previously out-of-the-money (OTM) puts that were now in-the-money had been much too inexpensive.
Before volatility skew entered the world, the theoretical value of options was determined by a single volatility per underlying. Say, 30% for IBM options or 20% for SPX options.
But the ’87 crash taught traders that some huge price changes could happen quickly in modern markets and that an out-of-the-money put valued at .20 should have been valued at 2.00 to account for those possibilities.
Instead of a single volatility for all options, each option would have its own implied volatility based on its market price. If the OTM put that was .20 is now 2.00, its implied vol would be much higher, too.
But it wasn’t just the crash of ’87 that gave rise to the skew. Technology played a role, too. The reason is that volatility skew is the curve of the implied volatility of the options, and to calculate implied vol for all the options requires a computer.
Quick definition: Implied vol is the vol input into a theoretical option pricing model (e.g., Black-Scholes) that makes the theoretical value of the option equal to its market value.
In other words, it converts the market price of the option into terms of volatility. When an option’s price is higher, all other things being equal, its implied vol is higher, too.
Skew to the rescue
It’s possible but cumbersome to calculate implied vol by hand. But it takes a computer to run the iterations required to find the solution. While Black-Scholes had been around since the ‘70s, the technology to calculate implied vols quickly and efficiently was just starting to gel in the ‘80s.
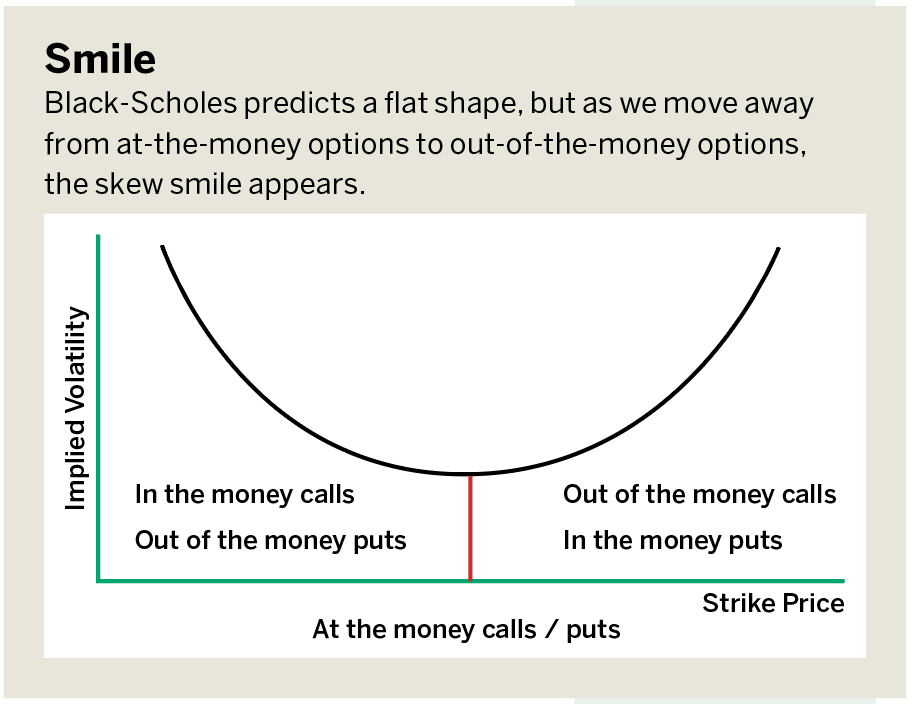
Once the implied vol for each option is calculated, the implied vol skew is the phenomenon where the implied vol is different across strike prices. The skew is a curve, sort of a wide, tilted “U” shape.
Skew is visible when there’s higher and higher or lower and lower implied vols for successively OTM calls and puts. When looking at OTM calls and puts equidistant from the at-the-money (ATM) strike, the side that has the higher implied vol “points” to where the market sees risk.
The reason is that market participants might be buying OTM puts because they fear a crash and drive up the put prices and in turn their implied vols. The skew would thus “point” to the downside.
Alternatively, the market might be buying up OTM calls because traders expect a big rally and drive up call prices and in turn their implied vols. This skew would point to the upside.
Typically, the skew points toward the downside for stocks and equity indexes, and toward the upside in commodities, although that’s not always the case.
Putting skew to work
The shape of the skew is driven by market supply and demand. Because it’s the result of buying and selling, it’s a real-time clue about which direction the market thinks the underlying (security) may be headed. And “thinks” is the operative word.
Just because the skew is pointing out risk in one direction or the other (underlying price higher or lower) doesn’t mean the price of the underlying stock, index or future will go there.
After all, the skew in SPX and /ES options was pointing down for years and the market moved higher during that time before it crashed in February and March of this year.
So, skew doesn’t tell where the market is headed, just where the market is afraid it might. If that’s the case, what value is skew to the trader? Rather than using skew to determine whether a stock, index or future might go up or down, skew should be used to inform strategy. Let’s see how.
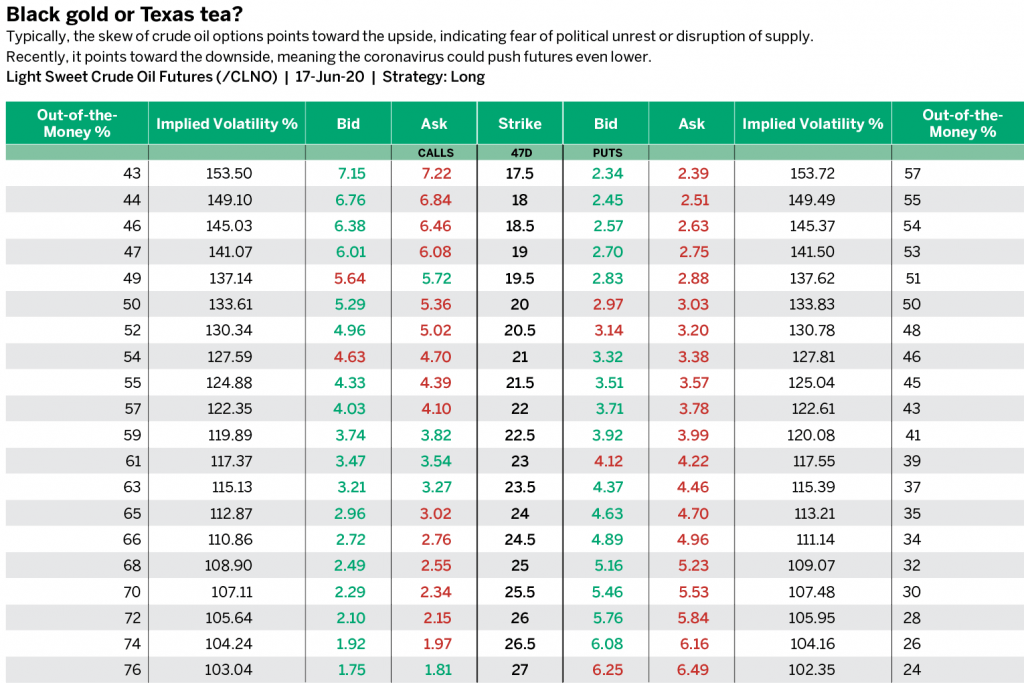
A product that recently crashed, and in fact had its price drop below zero, is crude oil. Crude oil and options can have interesting things in their skew. Typically, the skew of crude oil options is pointed toward the upside, which indicates the market fear that there could be a spike in crude oil because of political unrest or disruption of supply.
But recently, the skew in crude oil is pointed toward the downside, with the implied vol of OTM puts higher than that of equidistant OTM calls. That’s because the lower demand for oil after the impact of the coronavirus could push crude oil futures even lower.
This is an image of crude oil options with 47 days to expiration with the price of the crude oil underlying future at $22.30. The implied vol of the 20.5 put is 130.78%, higher than the 110.86% implied vol of the 24.5 call, and both options are roughly the same number of points OTM from the current price of crude oil.
The skew, then, is pointed toward the downside, and the prices of OTM puts are relatively high. Bullish and bearish strategies in crude oil can take advantage of the elevated put prices.
Traders who are bullish on crude oil might consider shorting the 21.5 put, for example. It’s worth about 3.54, and its implied vol is 125.16%.
The theoretical value of that put with the 120% ATM implied vol would be about 3.34. That’s .20 or 5.6% less than its current price. A way to think about it is investors willing to take the risk of a bullish trade in crude oil are taking in a 5.6% larger credit for doing so.
Now, the way implied vols and prices work is a bit more complex than that, but for trading purposes this makes sense. The higher credit for the short put means that the potential reward is higher and the risk is lower. But how does one work that short 21.5 put into a bearish trade?
Traders who are bearish on crude oil might consider the long 21.5/23.5 put vertical, which is short the 21.5 put and long the 23.5 put. The debit of that long vertical is lower because of the skew. If the 23.5 put is worth 4.40, and the 21.5 put is 3.54, the debit of the vertical is .86.
But if that 21.5 put was valued at the lower implied vol and was worth only 3.34, the debit of the vertical would be 1.06. In this case, too, the skew gives the long put vertical higher potential reward and lower potential risk because its debit is lower.
That .20 may not seem like a lot, but over the course of a trading career, selling each put for a bit more credit or buying each long vertical for a bit less debit by taking advantage of the implied vol skew can add up to a lot of money. That edge can make a big difference in the long term over thousands of trades.
This is just a simple example of how the skew can give each trader— the bull and the bear—an advantage. Combining knowledge of the skew and where rich and cheap options might be with knowledge of option trading strategies can give an investor’s performance a little boost, and increase both the potential profit and the probability of making money.