How Volatility Products Behave
One of the big winners from last week was the volatility space, which received an outsized amount of attention due to the rout in global stock market indices.
The VIX, or CBOE Volatility Index, had recently been pushed out of the investor consciousness as it dragged along the seafloor of the volatility landscape, languishing in the low teens.
That all changed Monday and Tuesday of last week when the VIX broke out in epic fashion and cruised past the 20-handle, before screaming toward 50 on Friday morning. The VIX ultimately closed the week at 40.11, its highest close since the flash crash of 2015.
Depending on your trading approach and risk profile, the VIX can mean different things to different people. A long-term investor might view heightened levels in the VIX as a chance to buy favored stocks at lower levels (for example: “buy the dip”), due to what might be perceived as only temporary uncertainty in the financial markets.
Other market participants might view a popping VIX as a chance to sell options premium, given that implied volatility in most underlyings expands when the VIX rallies.
For the latter group, there are other products in the volatility space that can also be considered when the VIX takes center stage.
It should be noted at the outset that the volatility products tend to be a bit more complex in their construction as compared to “normal” stocks and futures, which means investors might want to consider mock trading them to better understand their behavior before deploying “live” positions.
Having said that, these metrics can also provide additional market color on the context of volatility, and therefore may deserve a spot in the daily watch list.
The graphic below highlights some of the best-known volatility products in the U.S. financial markets, outside of the VIX:
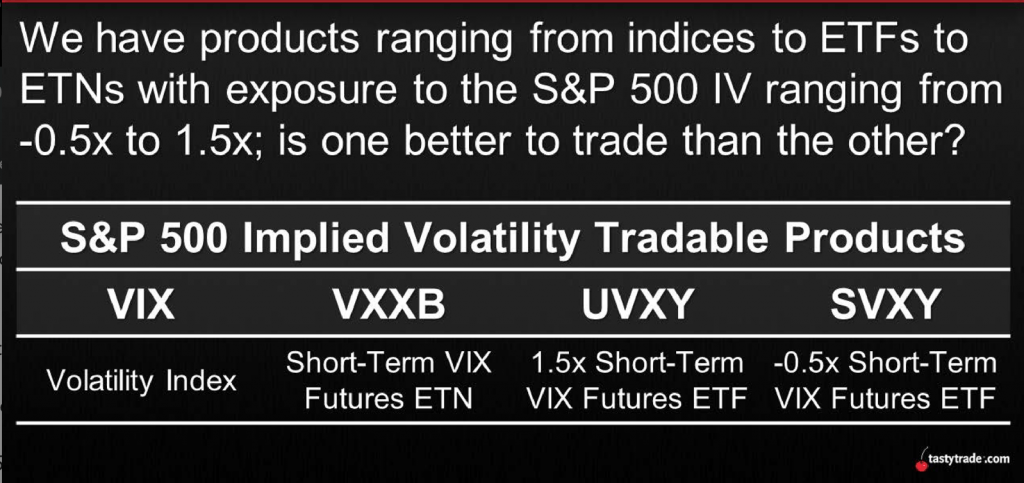
An expanded overview of the four products is detailed below:
- VIX: This is the famous (or infamous) CBOE Volatility Index which represents the market’s expectation of 30-day forward-looking volatility based on the inputs of S&P 500 options. It is commonly perceived as a measurement of market risk and investor sentiment. Market participants can access exposure to the VIX via associated futures and options.
- VXX: The VXX is an Exchange-Traded Note (ETN) that seeks to replicate the returns of a market benchmark – in this case that benchmark is the VIX. That means the VXX acts similar to the VIX, but not exactly the same. VXX can be bought, sold, or sold short like a stock, which the VIX cannot. VXX also has listed options. VXX uses VIX futures to pursue its goal of replicating the return of the VIX.
- UVXY: While the UVXY isn’t the same as the VXX, there are some similarities. As with the VXX, the UVXY seeks to replicate the return of the VIX, but in this case its goal is 1.5x the VIX (the VXXB would be 1x the VIX). The fact that UVXY seeks a 1.5x return is a good indicator of its true self – a leveraged Exchange-Traded Fund (ETF). The method by which the UVXY achieves its 1.5x mandate is by purchasing extra VIX futures (as compared to VXX) and also using margin (i.e. credit). As with any investment that involves credit, that dynamic means there are added complications when trading UVXY, and traders should research the product thoroughly before getting involved. The UVXY can be bought, sold, or sold short like a stock, and also has listed options.
- SVXY: While the VXX (an ETN) and UVXY (leveraged ETF) are designed to replicate the returns of the VIX (1x and 1.5x, respectively), the SVXY is what’s known as an inverse ETF. In practice, that means the SVXY is intended to move in the opposite direction of the VIX – to the tune of -0.5x. Generally speaking, the SVXY should therefore increase when volatility falls, and decrease when volatility increases. Like VXX and UVXY, the SVXY can be bought, sold, or sold short like a stock, and also has listed options.
Due to the importance of volatility in the modern financial markets, researchers at the tastytrade financial network sought to better understand the behavior and sensitivity of VXX, UVXY, and SVXY relative to the VIX.
The graph below shows historical movement in each of the four volatility products the last time there was a significant spike in volatility (the end of 2018). Highlighted in the large red square is the unique way that each of the four products responded to rising uncertainty:
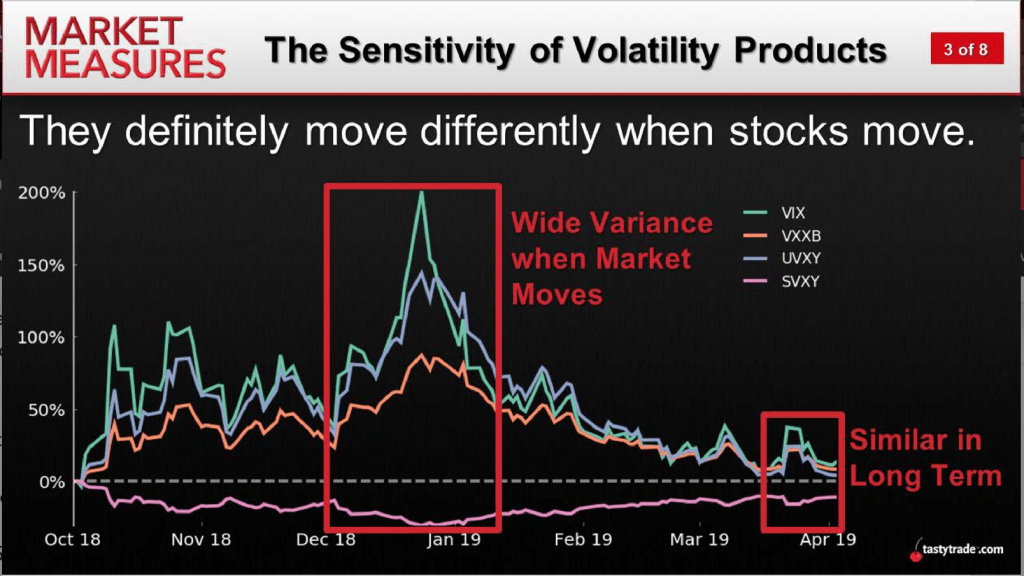
Looking at the individual lines of data in the above graph, one can see that the behavior of movement in each of the products does correspond with (to some degree) what one might expect during an expansion of volatility.
One thing that sticks out in the chart is the degree to which the VXX and UVXY lagged the VIX, especially since they are intended to “replicate” its return (particularly the UVXY which seeks 1.5x the return). However, an understanding of the mechanics of these products does help to explain this somewhat unexpected behavior.
VXX and UVXY use VIX futures to achieve their mandate, meaning administrators of these products are constantly required to roll existing positions into the new VIX futures month(s) when the old ones expire. Mechanically, this often results in selling the lower-priced, near-term VIX future, in favor of simultaneously buying a longer-dated VIX future that often comes with a higher price tag.
It’s this reality (selling low and buying high) that produces the “drag” effect illustrated in the chart above, and helps explain why VXX and UVXY were more muted in their response to the market chaos observed at the end of 2018.
Looking at SVXY, we see that it performed somewhat as expected – moving in the opposite direction of the VIX. Given the SVXY target of a -0.5x return on the VIX (i.e. reduced exposure), the less jagged behavior also makes sense.
Moving past the above historical snapshot of movement in the four products, researchers at tastytrade next decided to analyze the sensitivity of the four products in various market environments. In order to conduct this analysis, the Market Measures team utilized historical data in each going back to 2012.
The first slide below summarizes how each of the four products moved on average during “down” days in the S&P 500 since 2012. The second slide provides a look at the same data on “up” days in the S&P 500 over the same time frame.
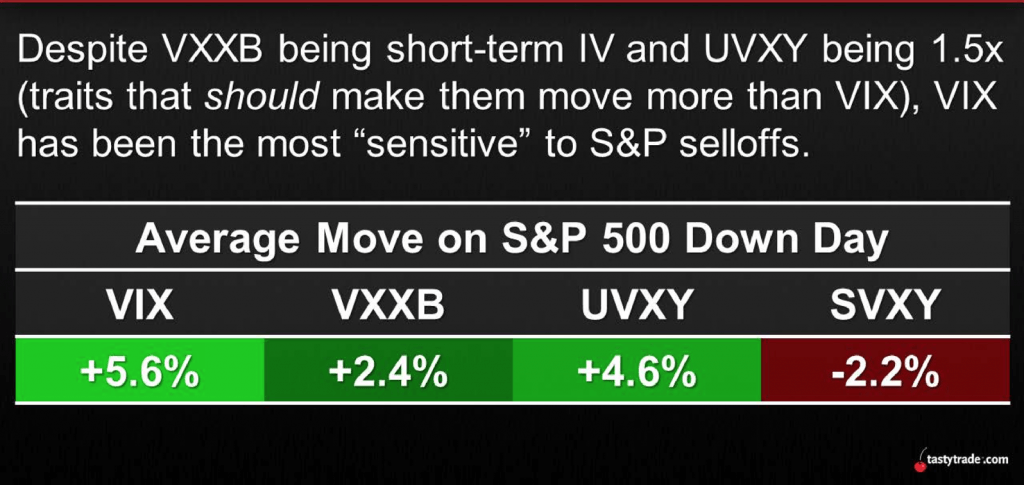
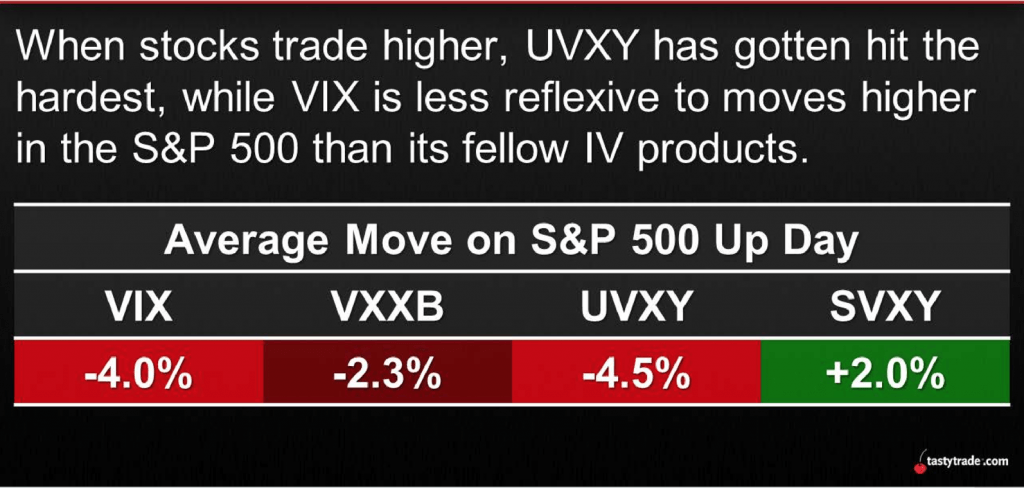
In general, the findings from this investigation appear to reflect what many might expect from each of the products, in terms of their respective behavior relative to the VIX.
One notable takeaway is how the expected behavior of the UVXY appears to be confirmed in both slides. No matter whether it was an “up” or a “down” day, the UVXY tended to experience a higher magnitude move than the VIX – proving that it indeed tends to achieve its 1.5x return mandate.
To learn more about the volatility product landscape, readers may want to review the complete episode of Market Measures focusing on this topic when scheduling allows. Information relating to the historical performance of short VIX strategies is also available here.
Sage Anderson is a pseudonym. The contributor has an extensive background in trading equity derivatives and managing volatility-based portfolios as a former prop trading firm employee. The contributor is not an employee of Luckbox, tastytrade or any affiliated companies. Readers can direct questions about topics covered in this blog post, or any other trading-related subject, to support@luckboxmagazine.com.