How to Structure a Volatility-based Pairs Trade
Much like traditional pairs trading, a volatility-focused pairs trade hinges on an existing strong correlation between the two underlyings

- Options traders use metrics such as Implied Volatility Rank to help identify attractive entry points in the options market.
- Using Implied Volatility Rank, options-focused investors can also identify potential volatility pairs.
- Volatility-focused pairs trades can be attractive when two highly correlated underlyings experience a divergence in their respective levels of implied volatility.
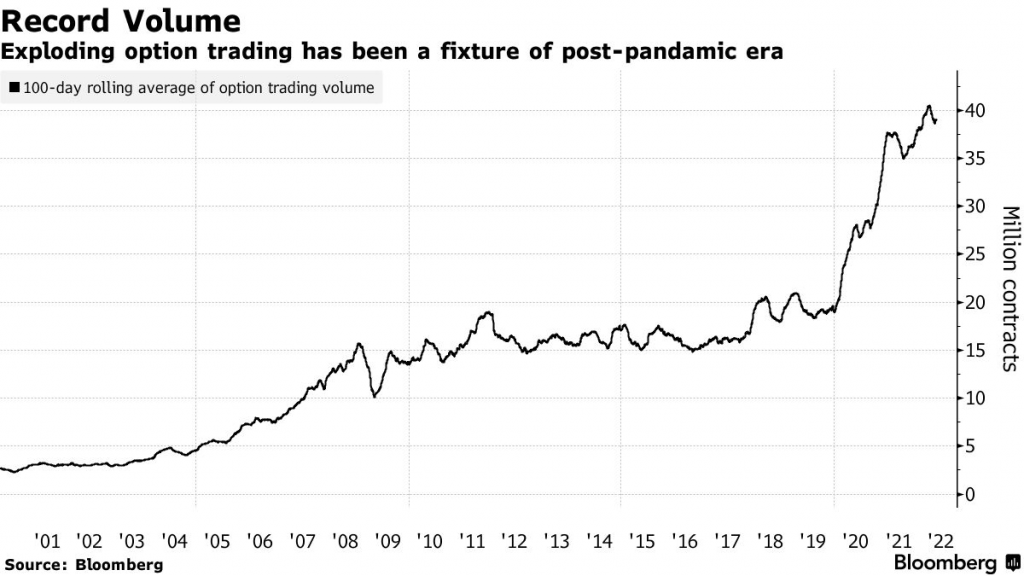
Options trading has exploded in recent years, as evidenced by the recent bonanza in zero-day options (0 DTE options).
One of the reasons for the splurge in options trading is due to a recent extreme in the CBOE Volatility Index (VIX). In early 2020, the onset of the COVID-19 pandemic triggered a jaw-dropping rally in the VIX, which surged to a fresh all-time high.
Big moves in the VIX tend to trigger increased interest in options trading activity. Over the last few years, options trading volumes have skyrocketed. New records for total options trading volume were set in 2020, 2021 and 2022.
Record spikes in the VIX lend themselves well to options-focused trading activity. But even when volatility is depressed—as it is now—there’s still typically a large number of attractive opportunities available in the market.
The importance of Implied Volatility Rank
To identify options-focused trading opportunities, traders typically use a metric such as Implied Volatility Rank (IV Rank). IV Rank reports the current level of implied volatility in a given underlying stock or ETF against the last 52 weeks of data.
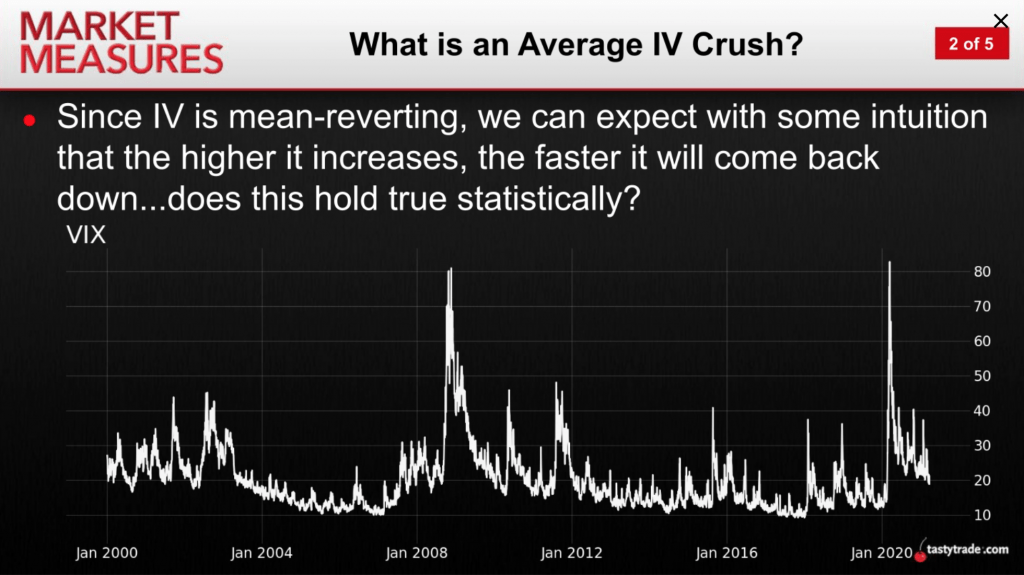
As a result, IV Rank allows investors and traders to quickly filter for opportunities where implied volatility is trading at an extreme. For example, the upper or lower end of the 52-week range. Options traders prefer to trade volatility at extremes because it is historically mean-reverting.
That means elevated levels of volatility tend to trend lower, back toward the historical average, while depressed levels of volatility tend to trend higher.
In terms of interpreting IV Rank, this metric is typically expressed as a value between 0% and 100%. For example, if implied volatility in hypothetical stock XYZ is trading at 50, and the 52-week range in implied volatility is between 25 and 75, that would indicate an IV Rank of 50%.
On the other hand, if implied volatility was trading at 25 in hypothetical stock XYZ, then IV Rank would be 0%, because 25 represents the lowest level of implied volatility observed over the last 52 weeks. Alternatively, if implied volatility was trading at 75, that would represent an IV Rank of 100%, because 75 represents the highest level of implied volatility observed over the last 52 weeks.
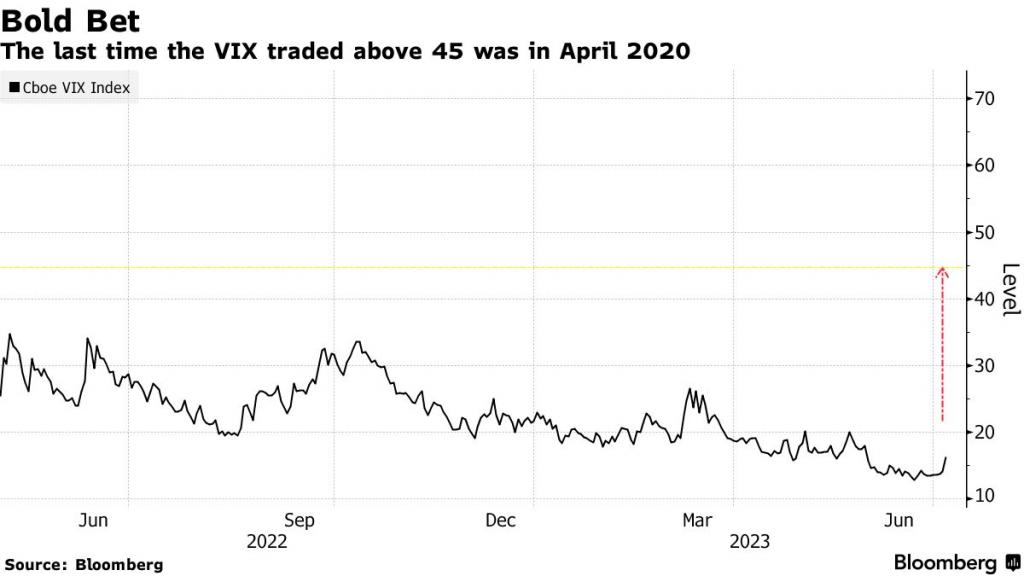
When IV Rank is above 50%, options traders typically look for opportunities to sell volatility. This is especially true when the VIX is trading at elevated levels. The long-term average in the VIX is roughly 19.
So, when the VIX starts trending into the 20s and 30s, options traders usually get more active selling derivatives. It should be noted that the VIX hasn’t traded above 40 since April 2020. So the next time the VIX does pop above 40, it will likely be triggered by a very significant development.
On the flip side of the coin, volatility-focused traders tend to look for buying opportunities when the VIX and IV Ranks are depressed. The VIX is currently trading at around 13, which is at the lower end of its recent range.
One thing options traders have to keep in mind, however, is the existence of time decay. As time passes, options lose value, because they draw closer to expiration. That natural headwind can work against options buyers.
How to pairs trade volatility
In addition to individual options positions, investors and traders can also consider additional volatility-focused strategies, such as spreads or volatility pairs.
This may include covered calls, which are one of the most common types of options-focused positions. Or it may include spreads, such as a long/short straddle, a butterfly, or a bull/bear vertical spread. However, another approach available to options traders is a volatility-focused pairs trade.
Much like a traditional pairs trade, volatility pairs hinge on a strong historical correlation between the two underlyings, whether they be single stocks or exchange-traded funds (ETFs). But instead of pairing a long versus short position in the two underlying stocks/ETFs, a volatility-focused pair involves buying the options of one stock/ETF vs. selling the options in another.
This approach is sometimes referred to as volatility dispersion. By pairing symbols with a strong historical correlation, traders can help isolate the volatility dimension of the trade.
That’s because when two underlyings share a strong correlation, they typically move in the same direction, and often to a similar degree. Volatility-focused pairs trades can be attractive when two highly correlated underlyings experience a sharp divergence in their respective levels of implied volatility.
For example, imagine two stocks from the crude oil sector that are highly correlated. In typical trading conditions, these two stocks would be expected to move in the same direction, to a similar degree.
Now imagine that one of the stocks trades with an elevated IV Rank, while the other trades with a depressed IV Rank. In that situation, an options-focused investor/trader might consider buying the options of the stock with depressed volatility, and selling the options of the stock with elevated volatility.
In this structure, the goal is to profit from a reversion to the mean in volatility. For example, if the elevated volatility were to trend lower, or the depressed volatility were to trend higher—or a combination of the two.
That’s why a strong, historical correlation is so important, because it helps ensure the two symbols will move together. Essentially, that established relationship helps reduce the risk of an unexpected gap move in one of the underlyings, but not the other. Gap moves are kryptonite for short options positions because they can trigger outsized losses.
However, under the pairs structure, the two underlying stocks/ETFs are more likely to move in the same direction, to a similar degree. That means any losses stemming from the short options position will hopefully be offset by gains in the long options position. And that’s very similar to how a traditional pairs trade works.
The risk, of course, is that some idiosyncratic risk (e.g. stock-specific risk) triggers a gap move in the short options position, which doesn’t trigger the same type of move in the long options position.
For example, imagine those same two stocks from the oil sector. If oil prices were to rally due to a significant geopolitical disturbance, both stocks would likely move higher to a similar degree. In that scenario, the holder of the volatility pair is somewhat insulated from a gap move.
On the other hand, if one of the stocks were suddenly acquired, triggering a big move to the upside, the other half of the pairs trade wouldn’t necessarily respond in the same fashion. In that scenario, the short options position would likely produce an outsized loss, as compared to a smaller gain in the long options position.
These are important things to keep in mind when setting up a volatility-focused pairs trade. And the aforementioned examples help illustrate why some investors and traders use index or sector/theme ETFs when establishing volatility pairs, as opposed to single stocks.
Using ETFs in volatility pairs
Unlike single stocks, diversified ETFs are less susceptible to gap moves. If an ETF does make a gap move, the corresponding ETF (the other half of the pairs trade) would likely respond in kind.
For example, if the SPDR Dow Jones Industrial Average ETF (DIA) were to spike by 5%, it’s highly likely that the SPDR S&P 500 ETF Trust (SPY) would rally by a similar amount. That’s because the major market indices share a strong, positive correlation.
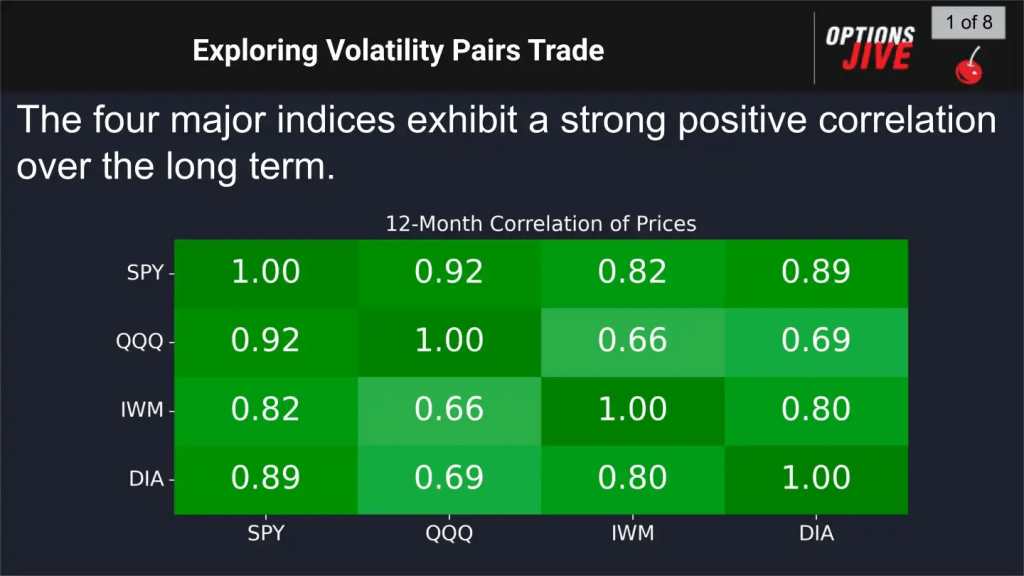
It’s hard to imagine the DIA making a big gap move higher, without the SPY responding in kind. That’s because both underlyings are major market indices that cover the U.S. stock market, and share a very strong historical correlation.
One can see why an options trader might consider pairing a single stock against an ETF. In this structure, the long volatility portion of the trade would be ideally focused in the single stock, while the short volatility portion of the trade would ideally be focused in the ETF.
ETFs are theoretically less susceptible to idiosyncratic risks, and therefore less susceptible to gap moves.
Looking at one final example, imagine if IV Rank was depressed in Exxon Mobil (XOM) and elevated in an oil-focused ETF such as the VanEck Oil Services ETF (OIH). Over the last three months the daily correlation between these two symbols is roughly 0.76.
Considering that both symbols hail from the oil sector, one could see how this situation might lend itself well to a potential volatility-focused pairs trade. Because the short volatility leg of the trade would be concentrated in an ETF, while the long volatility leg of the trade would be concentrated in the single stock.
That setup helps minimize the exposure of the short volatility position, because again, ETFs are theoretically less susceptible to gap moves.
Andrew Prochnow has more than 15 years of experience trading the global financial markets, including 10 years as a professional options trader. Andrew is a frequent contributor Luckbox magazine.
To learn more about volatility-focused pairs trading, check out this new installment of Options Jive on the tastylive financial network. And to follow everything moving the markets in 2024, including the options markets, tune into tastylive—weekdays from 7 a.m. to 4 p.m. CDT.
For live daily programming, market news and commentary, visit tastylive or the YouTube channels tastylive (for options traders), and tastyliveTrending for stocks, futures, forex & macro.
Trade with a better broker,open a tastytrade account today. tastylive, Inc. and tastytrade, Inc. are separate but affiliated companies.