Spotting a market bottom with the put/call ratio
Historical data demonstrates that extreme readings in the put/call ratio have been a fairly reliable indicator when it comes to signaling potential market bottoms

- The CBOE Volatility Index (VIX) has rallied by about 40% over the last 30 days.
- The VIX is currently trading about 20, which is slightly above its long-term average of 19.
- Historical data has shown that the Put/Call Ratio has been somewhat reliable at signaling market bottoms.
As predicted, the CBOE Volatility Index VIX has been rallying in September/October, and is now up roughly 40% over the last 30 days.
Historical data has consistently demonstrated that the volatility in the financial markets tends to increase in fall. And so far in 2023, that pattern has held true. Today, the VIX trades for about 20, which is slightly above the metric’s long-term average of 19.
The U.S. government recently averted a potentially calamitous government shutdown, which means the VIX could retrace temporarily. However, with the majority of the month of October still ahead, it’s hard to imagine that volatility has peaked in the near term.
Importantly, investors and traders can monitor another key fear gauge—the SPX put/call ratio—for further insight into ongoing risk sentiment on Wall Street.
The put/call ratio is fairly easy to understand, and is derived from daily trading volumes in the options market. For example, when an equal number of puts and calls are traded in the S&P 500, the put/call ratio is equal to 1.
On the other hand, when put volumes in the S&P 500 are greater than call volumes, the SPX Total put/call ratio rises above 1. And when call activity is greater than put activity, the ratio declines below 1.
Market participants often track the put/call ratio because it serves as a nice complement to the VIX. Today, the put/call ratio is trading around 1.49, which is at the upper end of the metric’s 2023 range.
Back in spring of 2020, the put/call ratio traded to a historical extreme (2.40) as put buying intensified in response to the spread of the first wave of COVID-19. During that same period, the VIX set a new all-time high, at 82.69.
Historically, some market participants have used extreme levels in the put/call ratio as an indicator for positioning in the market. For example, when the put/call ratio spikes toward or through 2, some market participants interpret that level of bearishness as a signal that the market has bottomed, or is nearing a bottom.
Along those lines, research conducted by Robert C. Koch provides further evidence of the put/call ratio’s utility at signaling market bottoms.
Analyzing 15 years of trading data (2007-2022), Koch found that “the put-call ratio can be a quite useful contrarian indicator to look at when market sentiment hits extreme negative levels.”Through his research, Koch discovered that the S&P 500 did exhibit “above average returns” 30-60 days after a significant spike in the put/call ratio, as illustrated below.
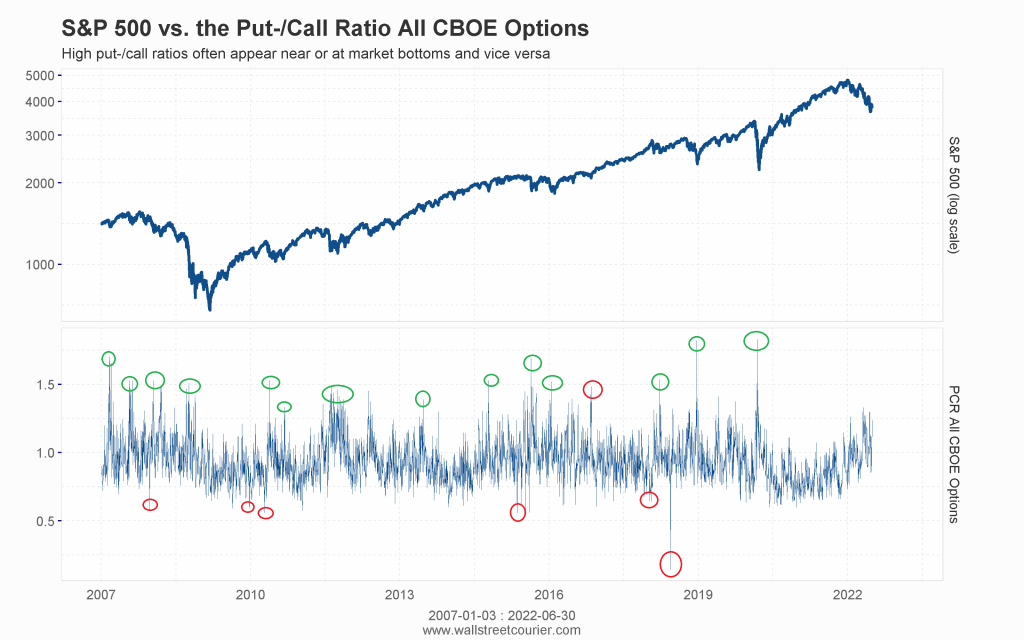
On the other end of the spectrum, Koch’s research also found that the put/call ratio is far less reliable when it comes to signaling potential market tops.
In these situations, the Put/Call Ratio drops well below 1, and according to Koch’s findings, “low put-call ratios mostly occur during strong bull markets, [and] it could be possible that high optimism within the option market might only cause consolidations and no major trend breaks within a positive market regime.”
These findings are highly relevant for active investors and traders, because they suggest that the put/call ratio can not only be used to monitor market sentiment, but also as a potential trading signal—especially when it comes to market bottoms.
Even so, the put/call ratio is probably best-utilized in tandem with other indicators—such as the aforementioned VIX, and the CBOE Skew Index (SKEW).
Using the VIX and Skew Index in tandem with the put/call ratio
In terms of fear gauges, the CBOE Volatility Index (VIX) and CBOE Skew Index (SKEW) are quite similar, but offer slightly nuanced views of risk sentiment in the financial markets.
For example, the VIX is calculated using at-the-money (ATM) options in S&P 500, whereas the Skew Index is calculated using out-of-the-money (OTM) options in the S&P 500. As a result of this subtle difference, the Skew Index is often viewed as an indicator of “tail risk” in the stock market.
Tail risk refers to a form of portfolio risk that captures the remote probability that the value of a given investment could move by more than three standard deviations from its current value. Visualizing a normal bell curve of investment returns, tail risk is therefore captured in the extreme ends of the curve—encompassing rare (and typically eye-popping) outcomes.
Like the VIX, interpreting the Skew Index is relatively easy. Traditionally, the Skew Index trades between roughly 100 and 150
Like the VIX, the Skew Index provides insight into activity in the options markets. And as market participants get more anxious about a big, unexpected move in the market, they buy OTM options premium, which pushes up the value of the Skew Index.
A lower reading in the Skew Index (100-120) therefore translates to a complacent risk environment, whereas an elevated reading in the Skew Index (150 and above) indicates that expectations for a big move in the market are rising (or peaking), as illustrated below.
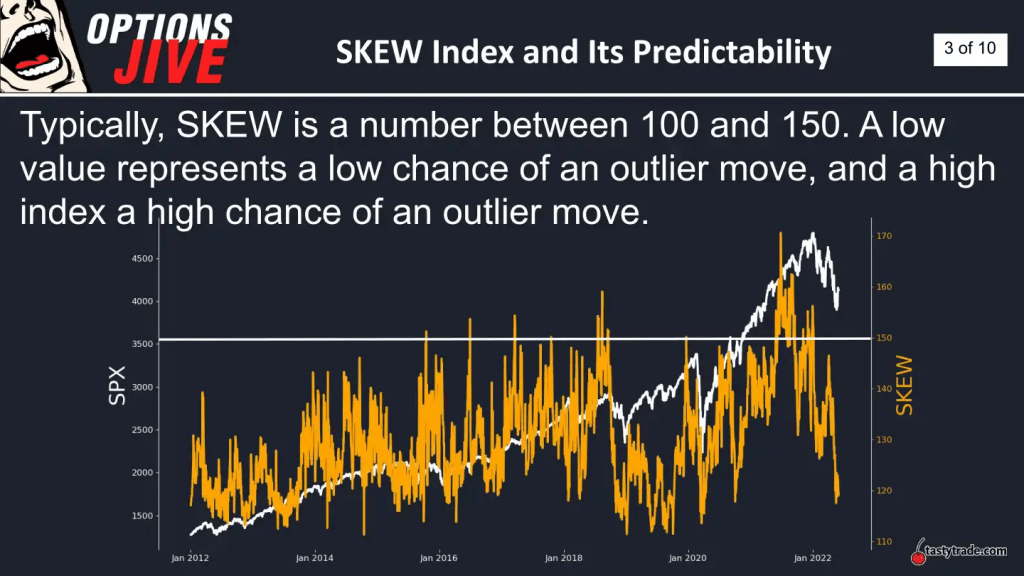
In March of this year, the Skew Index climbed toward 140 amidst the regional banking crisis. Today, however, the Skew Index is trading about 129. That reading indicates that market sentiment on tail risk in the financial markets is slightly elevated, but well below “crisis” levels.
All told, the aforementioned data indicates that the current risk sentiment on Wall Street is by no means at an extreme. However, the current readings in the VIX (20), put/call ratio (1.49) and Skew Index (129) all provide a benchmark by which investors and traders can use to monitor risk going forward.
If the major stock indices correct further, and the VIX spike further—alongside concurrent spikes in the Put/Call Ratio and Skew Index—then bullish investors and traders may feel that an attractive entry point has emerged, in terms of a potential market bottom.
As always, each investor/trader must weigh their own outlook and risk profile against existing market conditions and opportunities. In fast-moving markets (e.g. sharp corrections), many active market participants also scale back the size of their trades, due to the increased risks inherent in such environments.
To follow everything moving the markets this year, including the options markets, tune into tastylive—weekdays from 7 a.m. to 4 p.m. CDT.
Andrew Prochnow has more than 15 years of experience trading the global financial markets, including 10 years as a professional options trader. Andrew is a frequent contributor Luckbox Magazine.
For daily financial market news and commentary, visit the News & Insights page at tastylive or the YouTube channels tastylive (for options traders), and tastyliveTrending for stocks, futures, forex & macro.
Trade with a better broker, open a tastytrade account today. tastylive, Inc. and tastytrade, Inc. are separate but affiliated companies.
Hungry for more? The next issue of Luckbox is food-focused looking at new growth opportunities and trading ideas in food, beverage, agricultural, hospitality and grocery stocks. Not a subscriber? Subscribe for free at getluckbox.com.