Interpreting Indices
The Russell 2000 ETF IWM is the epitome of high risk, high reward when it comes to choosing a stock index.

Many passive investors wrongly believe all stock indices are the same. That misconception discourages them from expending much effort when choosing a stock to buy. In fact, many investors are content with knowing that they are participating in the “stock market” without knowing which stocks they own.
Stock indices measure the performance of a specific market sector, nation or region by tracking the prices of a group of stocks pertinent to the given market. For example, the most commonly quoted stock indices in the United States include the S&P 500, Dow Jones Industrial Average, Nasdaq 100 and Russell 2000.
Most investment choices consist of exchange-traded funds (ETFs) that either directly or indirectly track one of those indices, which makes a familiarity with their attributes essential when deciding on an ETF to buy.
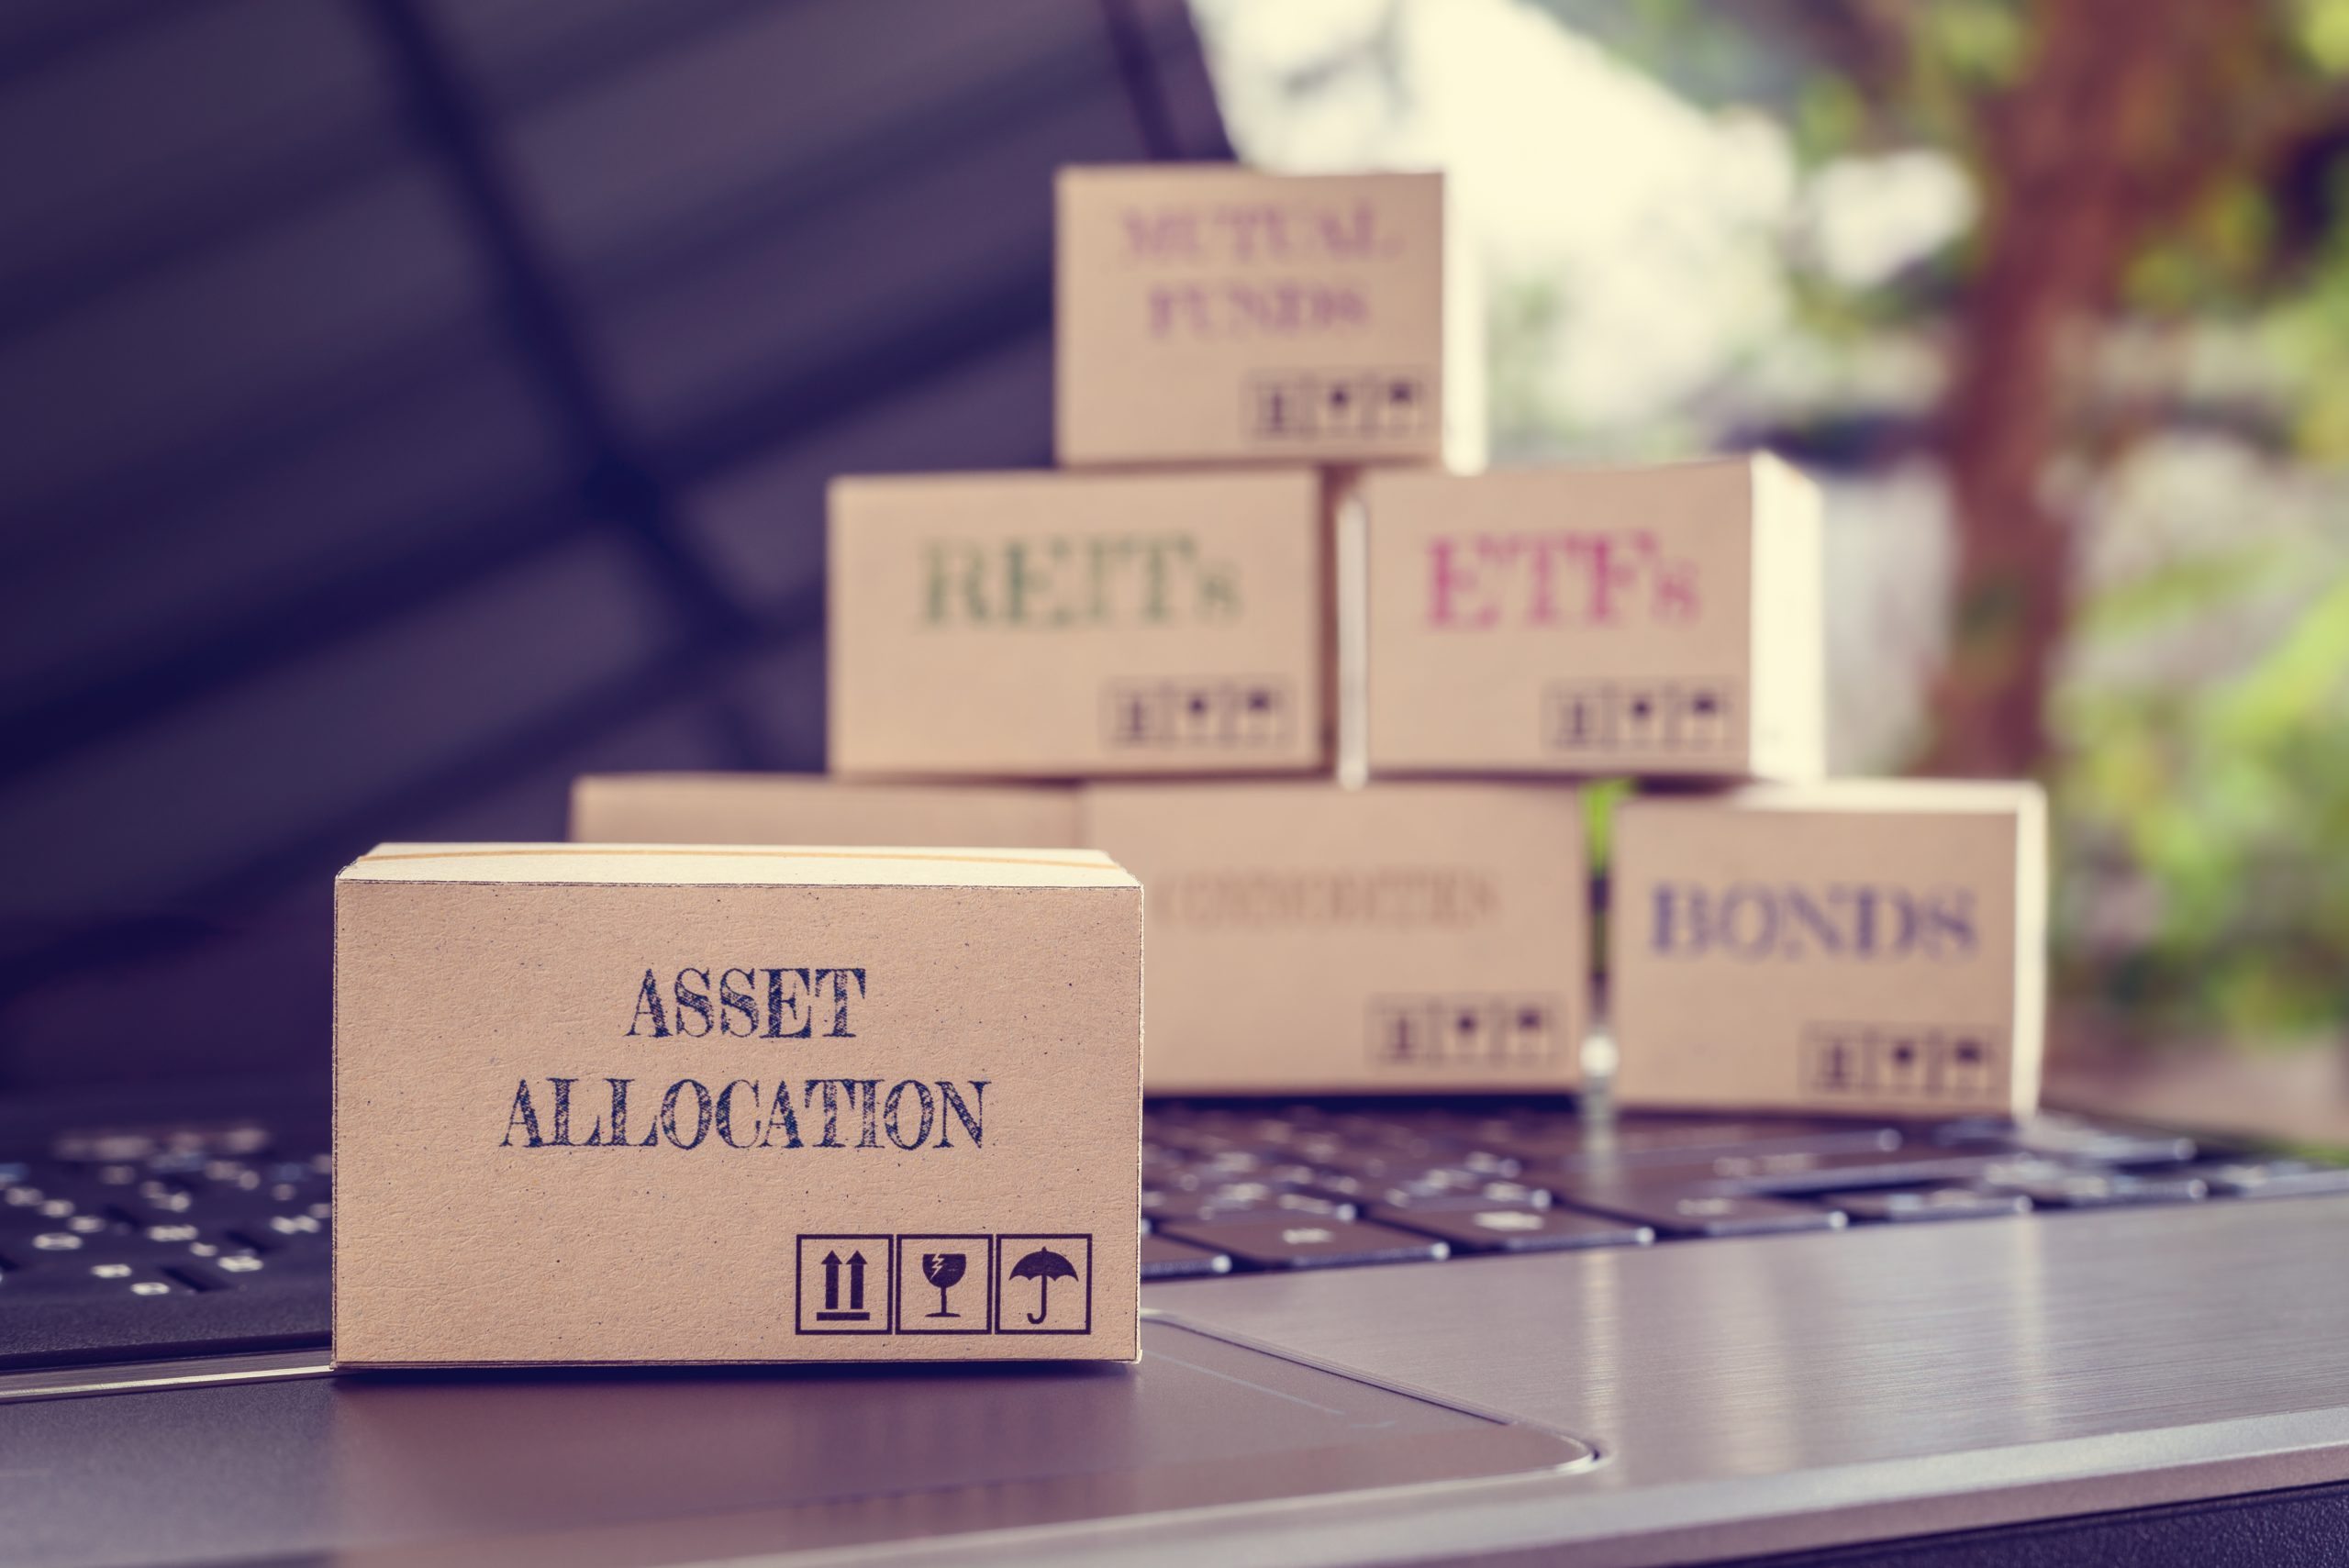
Index Contents
U.S. stock indices differ mainly in the names and quantities of the stocks they hold. Those distinctions cause them to trend in the same direction most of the time while exhibiting variable amounts of movement and risk.
The top holding in the S&P 500 is currently Apple
The top holding in the S&P 500 is currently Apple (AAPL), whereas the stock that holds down the top spot in the Russell 2000 is Five Below (FIVE). As of 2015, more than 40% of smartphone users in the United States employed the Apple iPhone (via statista.com). Five Below is not even one of the five largest public companies carrying the description “discount store” in the United States.
Sharing the moniker “stock market” does not necessarily denote shared holdings. While all 30 stocks in the Dow are also held in the S&P 500, not one of the Russell’s 2,000 stocks is shared by the S&P 500, Dow or Nasdaq 100.
That major discrepancy between the Russell and its three stock index peers is a function of its small-cap bias. Five Below, the Russell’s top holding, has a market capitalization around $6.5 billion. The stock with the smallest weighting in the S&P 500, News Corp., has a market capitalization of approximately $7 billion. (See “Index capitalizations,” below.)
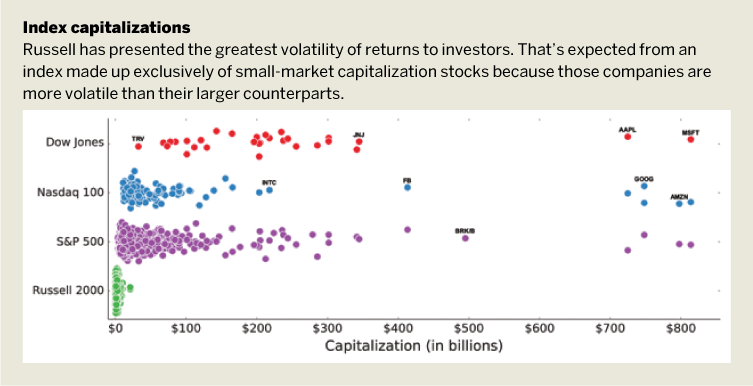
Though the S&P 500, Nasdaq and Dow have more in common with each other than they do with the small-cap Russell – all three indices show Apple in their Top 10 holdings – considerable differences in their sector components can influence their movement.
For example, the Nasdaq has a considerable bias to technology stocks, with approximately 50% of its stocks coming from that sector. Also, it’s the only major stock index that holds no financial stocks. The Dow is the only index with industrials taking the place of top sector exposure.
The S&P 500 and Nasdaq both weight their holdings by market capitalization; that is, larger companies receive larger percentages of the index’s exposure and thus have a greater influence on where the index moves. However, the Nasdaq has fewer stocks than the S&P 500, 104 versus 505, so it’s much top-heavier with big companies such as Apple and Amazon taking big weightings.
The Dow, on the other hand, is weighted by stock price, granting the greatest influence to the highest-priced stocks. That’s considered antiquated, which fits the oldest index in the United States. It was founded in 1885. Because of that formula, the Dow has a Top 5 holdings unlike any of the other major indices.
Volatility
Choosing the right index is not as simple as picking the strongest bull of the bull markets. Stocks have presented a great return during the last decade, but those gains did not come without volatility. Once again, the degree of volatility varies across the indices.
The S&P 500 and Dow have long been considered the safest indices with their greater diversification among market sectors and larger market capitalizations. And that’s for good reason because for a given average annual return, those two indices fluctuate the least around that mean on a yearly basis.
Though the Nasdaq has been the outperformer of the group since 2010, it has outperformed with greater volatility and wider ranges throughout the year than the S&P 500 or Dow. Buying stock just before a down year in the market requires a larger percentage move the following year to get back to even. That phenomenon is exacerbated by a more volatile market. So, while the Nasdaq is the most attractive of the bunch from a percentage return perspective, poor timing on entry could result in needing to dig out of a bigger hole.
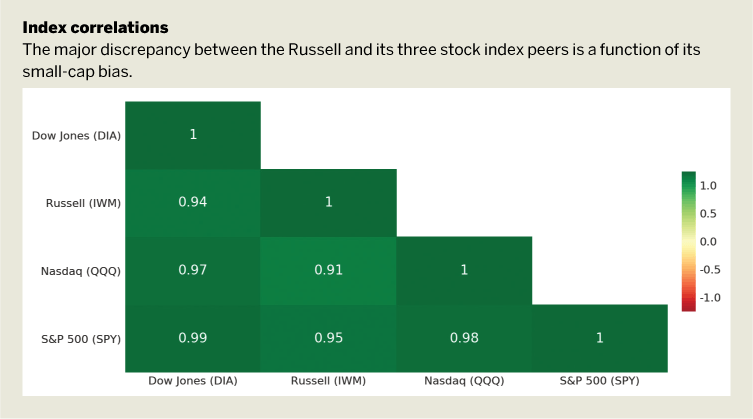
Finally, the Russell has presented the greatest volatility of returns to investors. That’s expected from an index made up exclusively of small-market capitalization stocks because those companies are more volatile than their larger counterparts. At 15.5%, the Russell’s annual standard deviation is almost 50% greater than that of the S&P 500. That volatility has not been kind to the small-cap index in recent years, with the Russell showing the worst returns of the four indices. However, volatility can work both ways, which makes the Russell subject to both large drawdowns and large rallies. (See “Index correlations,” below.)
The Choice
The S&P 500 ETF SPY, the most-traded of the major indices, is now considered the best benchmark for the U.S. economy. It presents upside that depends mostly on the technology sector, similar to Nasdaq, but it also has a more diversified outlook that presents less volatility. The S&P 500 gathers the best of both worlds with the large-cap stocks of the Dow and smaller companies that are nearly eligible to be held in the Russell.
Russell 2000 ETF IWM is the epitome of high risk, high reward when it comes to choosing a stock index
Buying shares of the Dow Jones Industrial Average ETF DIA presents the least volatile option, and it has not experienced the greatest upside in the last few years. DIA is a great choice for those looking to get stock exposure with a considerably smaller threat of large drawdowns.
The Nasdaq 100 represents the best alternative for trend followers. Technology has been the stock sector du jour recently, and that might continue for years to come. Those looking for a slightly diversified market that will mostly live or die by tech stocks should look no further than QQQ.
The Russell 2000 ETF IWM is the epitome of high risk, high reward when it comes to choosing a stock index. Made up of companies all under $10 billion in market capitalization, that market is capable of steep returns in either direction. Its relative underperformance in recent years could translate into greater gains in the future if it plays catch up with the Nasdaq, or smaller losses if stocks turn over into a bear market.
Frank Kaberna, a former professional trader, is an online personality for tastytrade.com, where he focuses on advanced futures and options strategies.