Options Trading Opportunities Multiply as VIX Surges to 6-Month High
The CBOE Volatility Index (VIX) recently notched a six-month high, signaling that perceived risks in the financial markets are rising

- The CBOE Volatility Index (VIX) recently notched a fresh six-month high, climbing to about 19.
- The VIX shares a strong, inverse correlation with the S&P 500, and the latter is down about 6% since peaking in late March.
- Hotter-than-expected inflation during the month of March has fueled a surge in Treasury bond yields and the U.S. Dollar Index, which has contributed to negative sentiment in the stock market.
After a six-month hiatus, volatility has returned to the global financial markets.
Last week, the CBOE Volatility Index (VIX)—one of the market’s best-known barometers of risk—hit a six-month high. As many investors and traders are aware, the VIX had been trading at relatively depressed levels since last November. But a combination of geopolitical tensions in the Middle East and a rebound in U.S. Treasury yields appear to have pushed the market’s well-known “fear gauge” back to about 19.
In historical terms, 19 isn’t a high reading in the VIX. In fact, it’s closer to the metric’s long-term average. But volatility in the markets has been relatively muted over the last couple of years. The VIX hasn’t traded above 40 since 2020, which is especially interesting considering the slew of negative geopolitical developments that have emerged in the interim—the outbreak of war in Ukraine and the recent escalation of hostilities in the Middle East, for example.
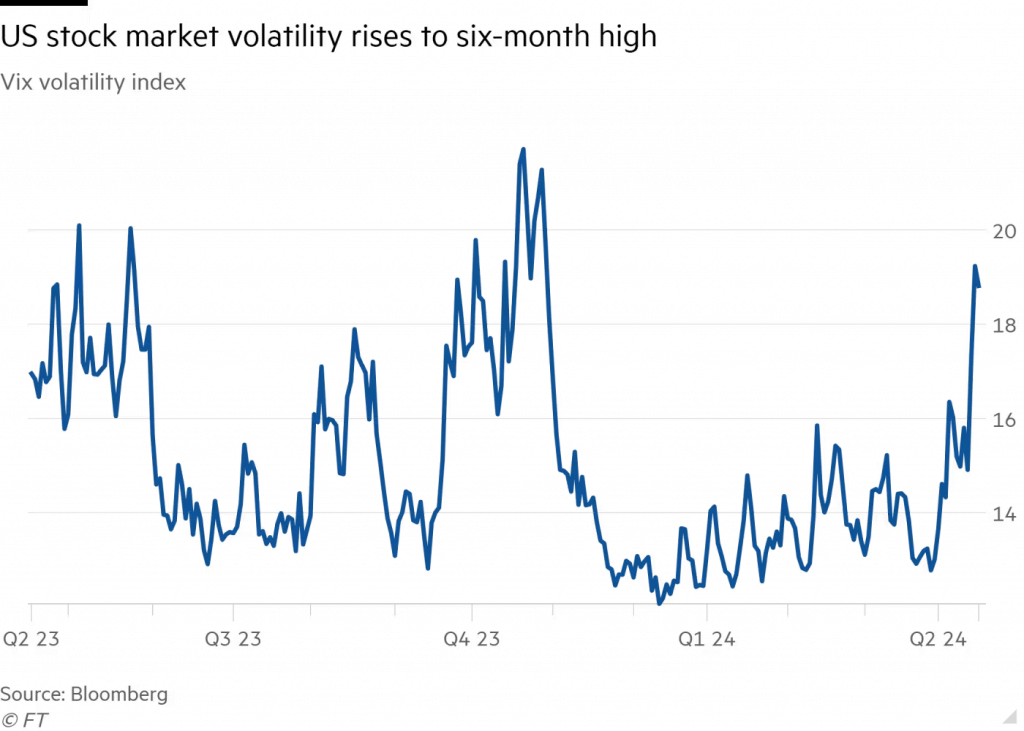
Historically, the VIX shares a strong inverse correlation with the major market indices, so it’s not necessarily a surprise that the VIX traded in muted fashion during the recent bull run in the stock market. But the stock market has slumped in recent weeks, which has been a bullish development for the VIX. Since peaking at around 5,260 in late March, the S&P 500 has fallen by roughly 6%.
In early March, a Luckbox article suggested that a 10% correction could be in the cards at some point in 2024, and that may be playing out now.
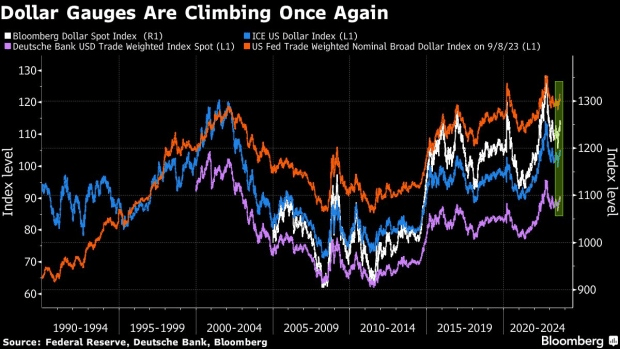
The U.S. dollar index surges to six-month highs
Looking beyond the VIX, another big story in the markets has been the surging U.S. dollar. Last week, the ICE U.S. Dollar Index closed above 106, which is just short of the metric’s 52-week high of 107.
Strength in the dollar appears attributable to the recent surprise uptick in inflation. Persistently high inflation could preclude the Federal Reserve from cutting benchmark interest rates as quickly as expected. And currency traders appear to have interpreted that as a bullish development for the dollar.
In Q4 of last year, most pundits expected the U.S. central bank to shift to a more dovish stance in early 2024. But that pivot hasn’t yet materialized, and the interest rates market is now forecasting the first rate will be delayed until July. That means “higher for longer” doesn’t just apply to interest rates, it also may apply to the dollar.
Last year, the rates market was expecting five or six rate cuts in 2024, but those expectations have now been whittled back to one or two.
Hard to fight the dollar’s strength
Speaking to the current trading environment in global currency markets, Vassili Serebriakov—an FX strategist, at UBS—recently told Reuters, “It’s really hard to fight dollar strength right now. U.S. data continues to suggest that the Fed is not going to be cutting any time soon.”
If interest rates remain higher for longer, that’s generally a positive for the greenback, all else being equal. That means going forward, the dollar’s future direction will hinge heavily on the monthly inflation report. If inflation continues to surprise to the upside, the dollar could even threaten its five-year high of 113.
The Dollar Index is calculated using the exchange rates of six major world currencies: the euro (EUR), Japanese yen (JPY), Canadian dollar (CAD), British pound (GBP), Swedish krona (SEK) and Swiss franc (CHF).
Due to the weighting methodology of the index, the primary driver of value tends to be the euro-dollar relationship. The euro makes up over 50% of the U.S. Dollar Index, and far outweighs even the second-place currency—the Japanese yen—which constitutes about 14% of the index.
In early April, the European Central Bank intimated it may cut rates in the next couple of months. And based on current projections, the ECB may do so ahead of the Federal Reserve. That’s likely a key reason the dollar has been gaining against the euro, and in the process contributed to the rally in the Dollar Index.
Rising bond yields are another cause for concern
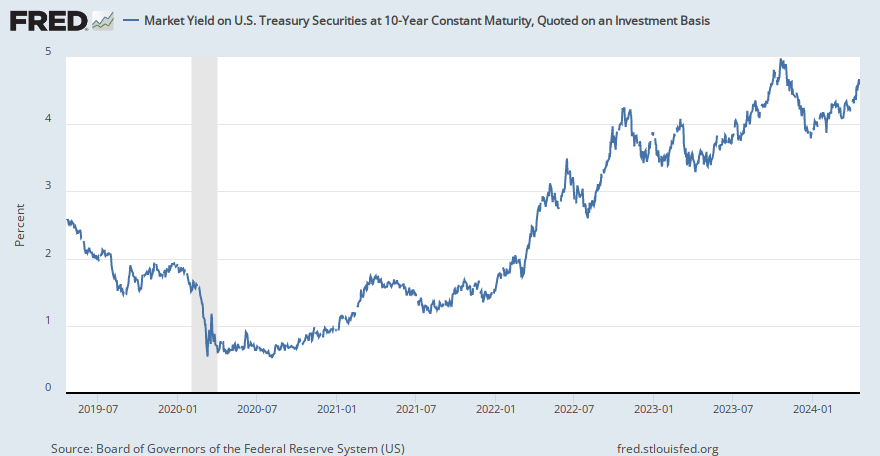
Another key development in the U.S. financial markets has been rising Treasury bond yields.
The Federal Reserve sets short-term interest rates using the federal funds rate. However, investors and traders typically track longer-term rates using U.S. Treasury bonds, which are subject to market forces. And because of the delayed rate cut, yields on U.S. Treasuries have been trending higher.
This move has been eerily reminiscent of last October, when rising yields also coincided with a pullback in the stock market. Today, the yield on the 10-year U.S. Treasury bond is around 4.60%, which is about 8% lower than its five-year high. It should be noted that this level is much higher than the yields observed for most of the last 15 years, as illustrated below.
Rising yields are typically a bad sign for the corporate sector because they are indicative of higher borrowing costs. Treasury yields are widely known as the “risk free rate,” which means corporations pay a premium to these rates when they issue bonds or borrow from banks. That’s why rising Treasury yields—as observed since the start of April—are another incremental negative for valuations in the stock market.
However, the impact of higher yields isn’t limited to the corporate sector. As a result of the recent uptick in Treasury yields, the average rate on a 30-year mortgage has risen to nearly 7.1%.
The upward trend in mortgage rates is also reminiscent of last autumn, when the financial markets experienced an uptick in volatility. Speaking to heightened anxieties in the rates market, Ales Koutny—head international rates at Vanguard—recently said, “We are in a danger zone right now.”
Looking at the situation from afar, it’s clear that the trends are interwoven. Investors and traders may want to track these three risk barometers especially closely going forward: the VIX, the Dollar Index and the 10-year Treasury yield. If the latter continues to rise, the VIX and the dollar will probably move higher, as well. And that probably wouldn’t bode well for the stock market.
What a sharp stock selloff could do
One must also consider the potential for a sharp selloff in the stock market, which could add another wrinkle to the interest rates market.
If that were to occur, demand for U.S. Treasury bonds would almost certainly spike, because of their “safe haven” status. Bond prices and bond yields share a strong, inverse correlation. So, in that scenario, Treasury yields could fall, at least temporarily.
Regardless, a sharp correction in the stock market would almost certainly push the VIX higher. And that environment would undoubtedly open a multitude of fresh opportunities to trade options/volatility—depending on one’s unique approach, market outlook and risk appetite.
To learn more about volatility trading and the VIX, readers can check out this installment of Options Jive on the tastylive financial network.
Andrew Prochnow has more than 15 years of experience trading the global financial markets, including 10 years as a professional options trader. Andrew is a frequent contributor Luckbox magazine.
For live daily programming, market news and commentary, visit tastylive or the YouTube channels tastylive (for options traders), and tastyliveTrending for stocks, futures, forex & macro.
Trade with a better broker, open a tastytrade account today. tastylive, Inc. and tastytrade, Inc. are separate but affiliated companies.