When Housing Starts Falter, Sell the Homebuilders
The homebuilding stocks have been one of the strongest sectors of the market in 2023, but if housing starts falter in 2024, homebuilding stocks could be ripe for a pullback

- The homebuilding sector has been one of the market’s strongest performers in 2023, with the iShares U.S. Home Construction ETF (ITB) and the SPDR S&P Homebuilders ETF (XHB) up 66% and 57%, respectively, on the year.
- Despite record high interest rates, new housing starts have been persistently strong in 2023, as illustrated by the recent 1.50 million new starts during the month of November.
- Any pullback in housing starts—especially a sustained downward trend—could weigh heavily on this sector, making it susceptible to a correction.
The financial markets are always unpredictable, but one of the big surprises in 2023 has been the homebuilders.
With only a few days left in the year, the two largest homebuilder ETFs—the iShares U.S. Home Construction ETF (ITB) and the SPDR S&P Homebuilders ETF (XHB)—are up 66% and 57%, respectively, on the year.
Considering that mortgage rates have been hovering at multi-year highs, the homebuilders seem like one of the market’s most unlikely heroes in 2023.
It certainly hasn’t hurt that the broader S&P 500 is also trading in positive territory. But other rates-sensitive industries, such as the real estate and industrial sectors, have been among the laggards in 2023.
So, what sets the homebuilders apart? Several key trends appear to have triggered a perfect storm for the homebuilders, pushing up revenues and earnings, along with associated stock prices.
One key to the homebuilders success in 2023 has been an undersupplied market. That has been driven not only by higher interest rates—forcing more people to stay in their current homes/mortgages—but also by a cyclical shortage of available units in the market.
On top of that, the U.S. consumer has remained resilient. Some of those resilient consumers have opted to build new homes because they can’t find what they want in the market.
Housing starts remain strong
For homebuilders, one of the most important monthly statistics is known as housing starts. The term hails from the realm of economics, and refers to the point at which a shovel physically enters the ground to build a new housing unit.
Housing starts are a leading economic indicator because they tend to be closely correlated with strength in the underlying economy. As the economy expands, so does housing starts, and vice versa.
A high number of housing starts indicates that building activity is strong, whereas a low number of housing starts indicates that building activity is weak. As such, one can see why builders prosper when housing starts are at the higher end of the historical spectrum.
During the month of November, housing starts clocked in at roughly 1.50 million units, which represents a fairly robust number, especially with interest rates hovering at multi-year highs.
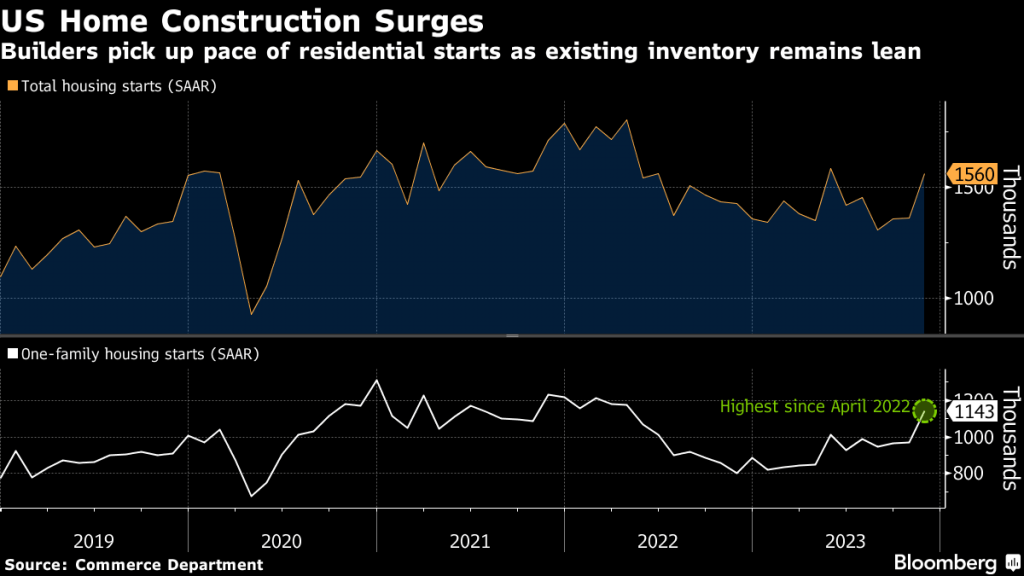
During the last 20 years, monthly housing starts have ranged between roughly 475K and 2.2 million, which means the current level of housing starts is still above the 20-year average, which is closer to 1.30 million units.
The low watermark for housing starts was set during the heart of the 2008-2009 Financial Crisis, when housing starts in the U.S. bottomed at 475K in April of 2009. Last month, housing starts were roughly 1 million units higher than that level, illustrating that new home building activity remains robust.
From the perspective of housing starts, the U.S. economy is clearly not in recession. And based on the housing starts figures alone, the economy might even be labeled robust.
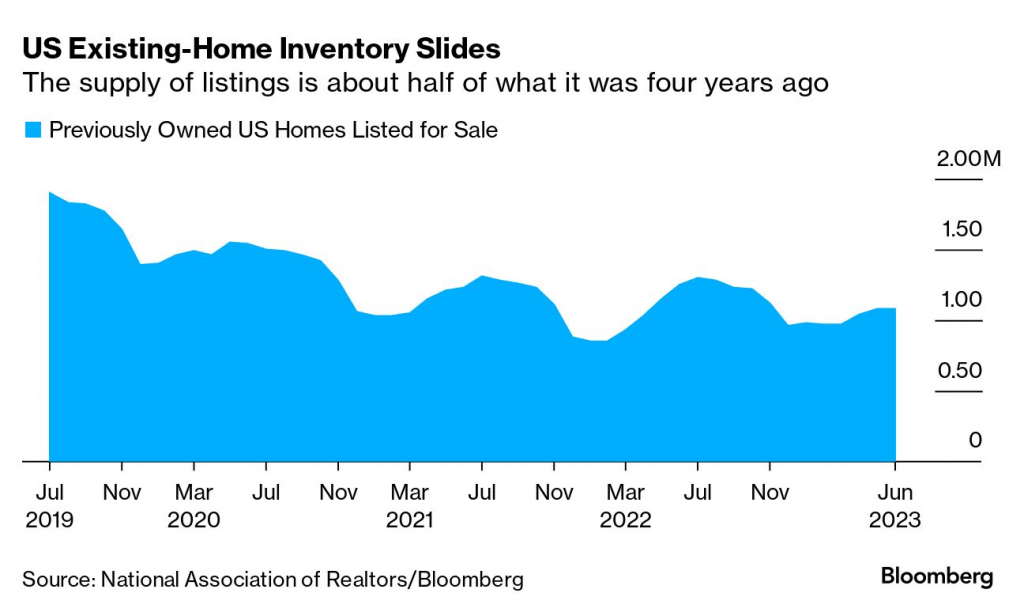
Market for existing homes is undersupplied
Importantly, one can’t assess housing starts in a vacuum. Looking at the broader housing market, housing starts appear to be riding high in part due to the unique dynamic in the current housing market.
Notably, the existing stock of available homes for sale in the secondary market is historically low. In November 2023, the number of previously owned homes for sale in the U.S. market was about 1.1 million units.
Prior to the COVID-19 pandemic, that same figure was closer to 2 million units, showing just how constrained the current market is for previously-owned homes.
One reason for the aforementioned situation ties back to elevated interest rates. According to data compiled by Redfin, 85% of homeowners in the U.S. are currently locked into mortgages at a rate of 5% or less. But as of late December, the prevailing mortgage rates are hovering at closer to 7%.
As a result, many existing homeowners can’t, or don’t want to, exit their existing home loans because the rate on their new loan would be substantially higher. That’s one of the big reasons that the number of available homes for sale is so low at this time.
On top of that, many housing experts have argued that the current U.S. housing market is also critically undersupplied from a cyclical standpoint. According to Freddie Mac, the U.S. housing market has fallen behind by about 4 million units.
That shortage is exacerbating the current inventory shortage when it comes to existing homes available for purchase on the market. One of the reasons for the shortage ties back to the 2008-2009 Financial Crisis, which was in many ways a housing crisis.
Due to the sharp pullback in home values, lenders and builders shied away from building fresh inventory. The sector has been playing catch up ever since. The COVID-19 pandemic certainly didn’t help, with many construction workers furloughed for a significant amount of time during this period.
Risks facing the homebuilding sector
Both the iShares U.S. Home Construction ETF (ITB) and the SPDR S&P Homebuilders ETF (XHB) are up nearly 60% in 2023.
Looking further back, however, ITB and XHB are up 242% and 200%, respectively, over the last five years. Those are gargantuan returns, especially for a sector that traded most sideways from May of 2006 through February of 2020.
Back in May of 2006, the ITB was trading at roughly $50/share. By February of 2020, ITB was still trading $50/share. Since February of 2020, ITB is up roughly 104%, and currently trades for about $102/share. XHB, for its part, traded in almost identical fashion over those same periods.
Considering that context, one could argue that the current rally in the homebuilders is getting long in the tooth. And if housing starts falter at some point in H1 2024, it’s easy to envision this sector suffering a sharp pullback.
Exhibit A for this thesis is the 2008-2009 Financial Crisis. Back then, the homebuilding stocks got decimated when housing starts began to falter. Leading up to the Financial Crisis, housing starts peaked at roughly 2.2 million in January 2006. That’s about 700K starts (per month) higher than what’s observed today.
However, by April 2007, that figure had dropped from 2.2 million starts down to 1.5 million starts. By June 2008 housing starts were down to 1 million per month, and by April 2009 that figure had cratered all the way down to 500K per month.
That means from April 2007 to April 2009, housing starts dropped from 2.2 million per month down to 500K per month. During that same period, the the iShares U.S. Home Construction ETF (ITB) fell by roughly 80%.
This example suggests that any meaningful pullback in housing starts—especially a sustained downward trend—would likely represent a significant negative for the sector.
Back in 2008-2009, the key driver of slowing housing starts was a severe recession. But that doesn’t mean a severe recession will be required to push down housing starts in today’s market. At some point, the building frenzy that has been observed in the last several years will likely lose steam—whether that’s due to persistently high rates, or a significant uptick in available housing stock.
That said, a recession would also undoubtedly weigh on housing starts, which is why investors and traders holding long positions in the homebuilding sector should be especially vigilant at this time. Conditions can shift abruptly in the financial markets, and in those cases, an unlikely hero can easily transform into a likely loser.
If the economy’s leading indicators—such as housing starts—start to falter, that could be a sign to lighten exposure to the homebuilding sector. Or possibly even a signal to initiate a short position (using stock or options), depending on one’s outlook, strategic approach and risk profile.
To follow everything moving the markets in 2024, including the options markets, tune into tastylive—weekdays from 7 a.m. to 4 p.m. CDT.
Andrew Prochnow has more than 15 years of experience trading the global financial markets, including 10 years as a professional options trader. Andrew is a frequent contributor Luckbox magazine.
For daily financial market news and commentary, visit the News & Insights page at tastylive or the YouTube channels tastylive (for options traders), and tastyliveTrending for stocks, futures, forex & macro.
Trade with a better broker, open a tastytrade account today. tastylive, Inc. and tastytrade, Inc. are separate but affiliated companies.