Trading Gold Volatility Amid the Recent Price Spike
Volatility in the gold market has been rising along with prices, as evidenced by the recent 30% spike in the CBOE Gold Volatility Index (GVZ)

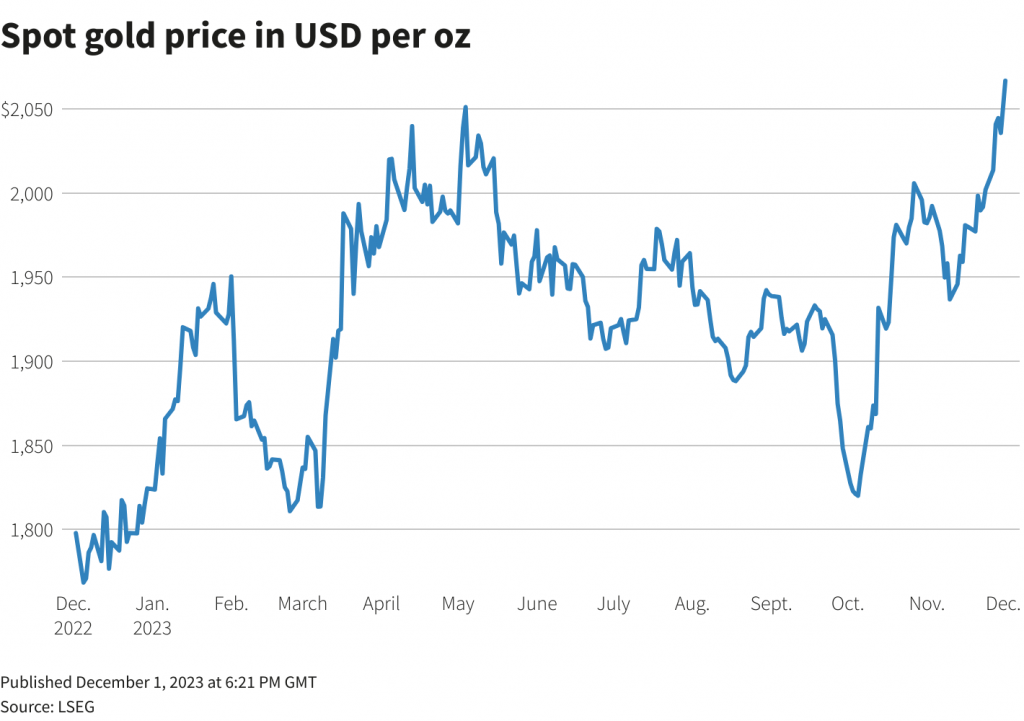
- The price of gold recently notched a fresh all-time high at roughly $2,090/ounce.
- Rising prices have triggered increased volatility in the sector, with the CBOE Gold Volatility Index (GVZ) recently climbing by nearly 30%.
- Options in gold-focused equities often trade with upside skew, making covered calls especially attractive in this sector of the markets.
At the start of November, we wrote that gold prices looked attractive. Since that time, gold has rallied by about 5%, closing recently at a fresh all-time high of roughly $2,090/ounce.
Back in early November, gold was in a position to benefit from a pullback in the U.S. dollar, which is exactly what’s come to pass. Now that the Federal Reserve has stopped raising interest rates, gold could benefit from further weakness in the dollar.
However, there’s more to the gold market than just the underlying price. Investors and traders active in the precious metals market can also track and trade gold-related volatility, much as they do in other parts of the financial markets.
To monitor gold volatility, investors and traders can add the CBOE Gold Volatility Index (GVZ) to their watchlists, which is effectively the “VIX of gold.” Much like the VIX, extremes in GVZ can be indicative of options-related trading opportunities in the marketplace.
For example, when the VIX spikes above its long-term average of roughly 19, some options traders filter for potential opportunities to sell volatility. When the VIX drops below its long-term average, as it has recently, there can be an opportunity to purchase volatility.
Volatility in the gold market has picked up in recent days, with the GVZ spiking by nearly 30% in the space of a week.
For context, GVZ has ranged between roughly 10 and 24 over the last 52 weeks. Looking further back, GVZ has ranged between roughly 10 and 36 over the last five years. Today, GVZ trades at about 17, which represents roughly the midpoint of the metric’s 52-week range.
If gold volatility continues to climb, there may be additional opportunities to trade volatility/options in this sector.
Selling covered calls in gold-focused products
An interesting aspect of the gold market is that volatility tends to be skewed towards upside calls.
That’s vastly different from the options structure of most other markets, where volatility is typically skewed toward downside put options.
Put options typically trade at a richer price than calls (all else being equal) because of the risk of sharp correction in the financial markets. As a result of this risk, there’s a natural bid for insurance/protection, which effectively raises the price of at-the-money and near-the-money puts.
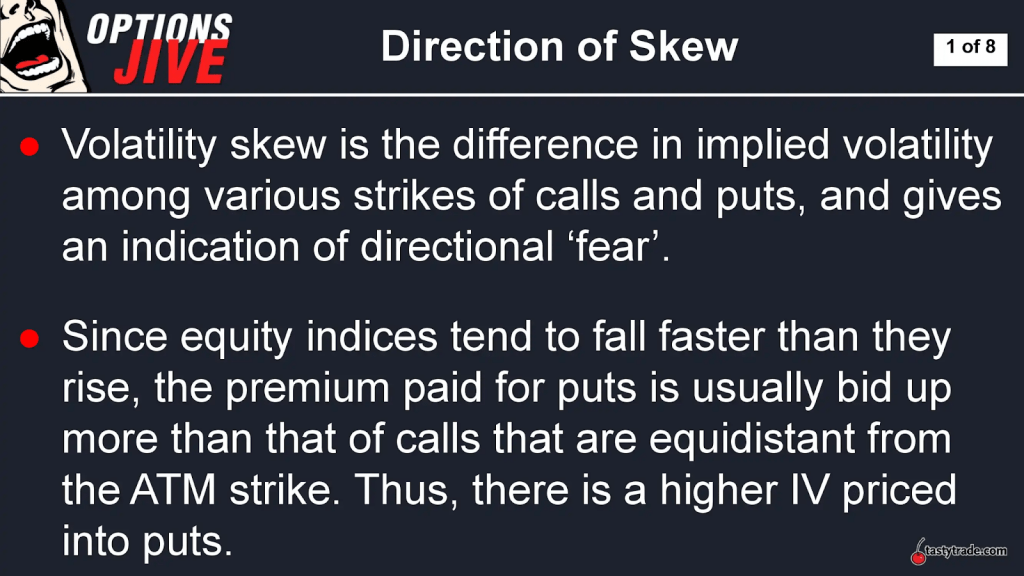
However, in precious metals markets—particularly those levered to gold—options prices are typically skewed to the upside. That means upside calls often trade at a premium to downside puts, all else being equal. This situation is believed to stem from gold’s “safe haven” status.
Safe havens are niches of the financial markets that retain or gain value during periods of heightened volatility. When fear enters the market, some investors and traders seek out safe havens in order to help limit losses—or to make positive returns.
During the last couple of financial crises in 2008 and 2020 (the Financial Crisis and the COVID-19 pandemic), investors and traders fled to government bonds and precious metals as a place to park capital. That means safe havens have the potential to spike in price amid a correction in the stock market, which in turn helps explain why gold call options are often priced more richly than the puts.
As a result of the aforementioned situation, the gold market—including gold-focused equities and ETFs—is often viewed as fertile ground for options sellers. As a general rule, options sellers gravitate toward expensive premium.
However, due to the risk associated with naked short options, most options traders focus on covered short options, such as covered calls. A covered call is constructed by selling an upside call option against an existing long stock position, or by deploying a short call in tandem with a new long stock position.
When and investor/trader expects the associated underlying to trade sideways, or moderately lower/higher, covered calls can be especially attractive. If an investor/trader is expecting a sharp spike in the underlying, or a sharp drop in the underling, then a covered call isn’t necessarily the preferred approach.
In terms of risk profile, covered calls work best when the underlying trades sideways, or moves slightly higher/lower, within a relatively narrow range. Under this scenario, the investor/trader gets to keep the premium received from the sale of the call option and achieves the maximum profit.
On the other hand, if the underlying rises well above the strike price of the short call, the investor/trader will likely have to surrender their shares of the underlying to the call buyer. This scenario isn’t a disaster, but it does limit the potential gains from the long stock position.
The worst case scenario for a covered call actually results from a sharp correction in the price of the underlying. Under this scenario, the long stock position suffers significant losses. In that situation, the short premium the investor/trader collects from the short call actually helps offset the losses from the stock position.
Watch this video on what a covered call is and how to trade one.
The importance of implied volatility when trading options
Most investors and traders use an asset’s underlying price as a signal to buy and sell in the financial markets.
For example, if hypothetical stock XYZ hits a 52-week low, contrarian investors bullish on the stock might view that development as an attractive buying opportunity. Along those lines, a multi-year high XYZ’s stock price might be viewed by some as a good opportunity to sell, or at least lighten one’s position.
However, the market is filled with additional data points that can also serve as signals for different trading strategies. Along those lines, one key source of information can be found in the options markets. Options are priced in dollars and cents, but savvy options traders also track and trade what’s known as implied volatility.
Implied volatility reflects how the market thinks a given underlying will move in the future. High implied volatility indicates the market is expecting larger price swings in the underlying. On the other hand, low implied volatility typically indicates that the market is expecting smaller magnitude moves in the underlying.
Looking at an example, imagine that implied volatility hypothetical stock ABC is 20%. That indicates investors and traders expect the underlying stock to move with annualized standard deviation of roughly 20%. So if ABC was currently trading for $100/share, then the market would be expecting the stock to trade between $80/share and $120/share over the next year.
In the options market, investors and traders typically refer to the current level of implied volatility in relation to the most recent 52 weeks of data. So if implied volatility had ranged between 20% and 50% over the last 52 weeks, one might view 50% as relatively high, and 20% as relatively low.
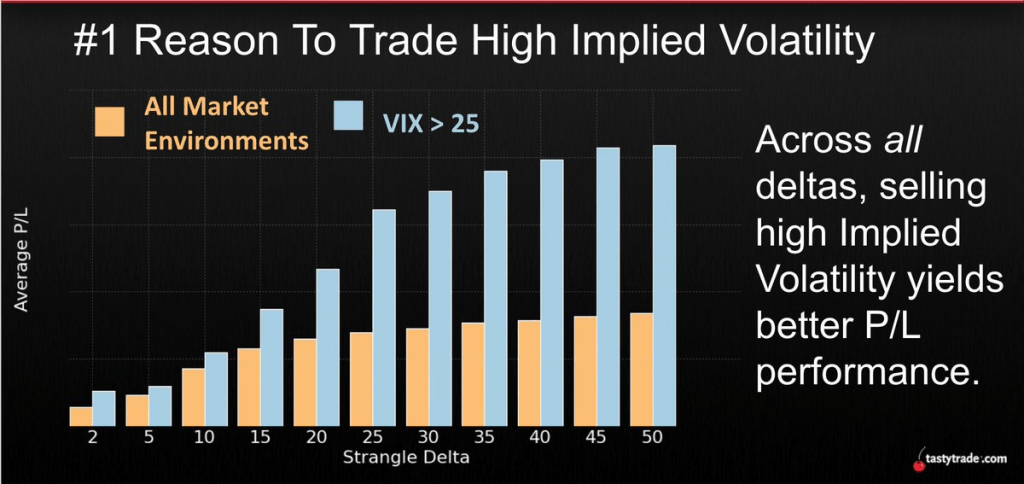
Historically, implied volatility has shown a tendency to be mean reverting, which means elevated levels of implied volatility tend to trend lower, while depressed levels of volatility tend to trend higher.
As such, investors and traders often consider selling options when implied volatility ranges toward the upper end of its 52-week range, and consider buying options when implied volatility trends toward the lower end of its 52-week range. The graphic below illustrates why it’s preferred to sell options when implied volatility is at the higher end of its historical range.
Using IV Rank to identify elevated levels of implied volatility
In order to track and trade volatility, most market participants use a metric like implied volatility rank, or IV Rank.
IV Rank reports how the current levels of implied volatility in a given underlying compare to the previous 52 weeks of data. IV Rank ranges between 0-100, where 0 represents the lowest implied volatility over the last 52 weeks, and 100 represents the highest implied volatility over the last 52 weeks.
For example, if implied volatility ranged between 30% and 60% during the last 52 weeks in hypothetical stock XYZ, and implied volatility is currently trading at 45%, XYZ would have an IV Rank of 50. On the other hand, if implied volatility was 30% in XYZ, then IV Rank would be 0, indicating the current level was on par with the lowest level observed in the last 52 weeks.
In order to filter for potential opportunities to sell volatility, investors and traders typically track IV Rank. It can also help to track broader gauges of volatility, such as the VIX or the aforementioned GVZ.
The list below highlights some of the best-known equities from the gold universe, sorted by associated IV Rank (highest to lowest):
Current IV Ranks in gold-focused equities
- DRDGold (DRD), 52.5
- SPDR Gold Trust (GLD), 50
- Newmont Corporation (NEM), 48
- VanEck Gold Miners ETF (GDX), 44
- Franco-Nevada Corp. (FNV), 40
- Barrick Gold Corp. (GOLD), 36
- Agnico Eagle Mines (AEM), 33
- VanEck Junior Gold Miners ETF (GDXJ), 32
- Royal Gold (RGLD), 26
- Compania de Minas Buenaventura (BVN), 22
As shown above, the IV Ranks for some of gold-related stocks and ETFs are trending toward 50, suggesting that new opportunities to sell options/volatility in this sector may materialize in the near future.
This is especially true for investors and traders who hold existing long equity positions (stocks or ETFs) in the sector. To track ongoing volatility in the gold space, market participants can monitor the CBOE Gold Volatility Index (GVZ).
If GVZ moves closer to the upper end of its 52-week range, that would be a strong indicator that implied volatility in gold-related equities is moving higher, and that opportunities in the options market have multiplied. Today, GVZ is trading about 17, with a 52-week high of 24.
Should GVZ trend toward the upper end of its 52-week range, covered calls may be an intriguing prospect—especially for those investors and traders who think the gold rally is running out of steam.
As outlined previously, upside calls in the gold sector tend to trade at higher premiums, which is what makes covered calls so enticing when volatility is rising.
To learn more about trading covered calls, readers can check out this installment of From Theory to Practice on the tastylive financial network. To follow everything moving the markets, tune into tastylive—weekdays from 7 a.m. to 4 p.m. CDT.
Andrew Prochnow has more than 15 years of experience trading the global financial markets, including 10 years as a professional options trader. Andrew is a frequent contributor Luckbox Magazine.
For daily financial market news and commentary, visit the News & Insights page at tastylive or the YouTube channels tastylive (for options traders), and tastyliveTrending for stocks, futures, forex & macro.
Trade with a better broker, open a tastytrade account today. tastylive, Inc. and tastytrade, Inc. are separate but affiliated companies.