What to Know About the Collapse in the Soybean/Corn Ratio and Pairs Trading
The soybean/corn ratio peaked in late August, but has since retraced back toward its historical average, thus creating a tidy profit for pairs traders that pounced on this opportunity in late summer
- In late summer the coybean/corn ratio climbed toward the higher end of its historical range, providing an opportunity for pairs traders involved in commodities futures.
- Since that time, the soybean/corn ratio has retraced back toward its historical average, thus creating a tidy profit for those that deployed the short soybeans versus long corn pairs trade.
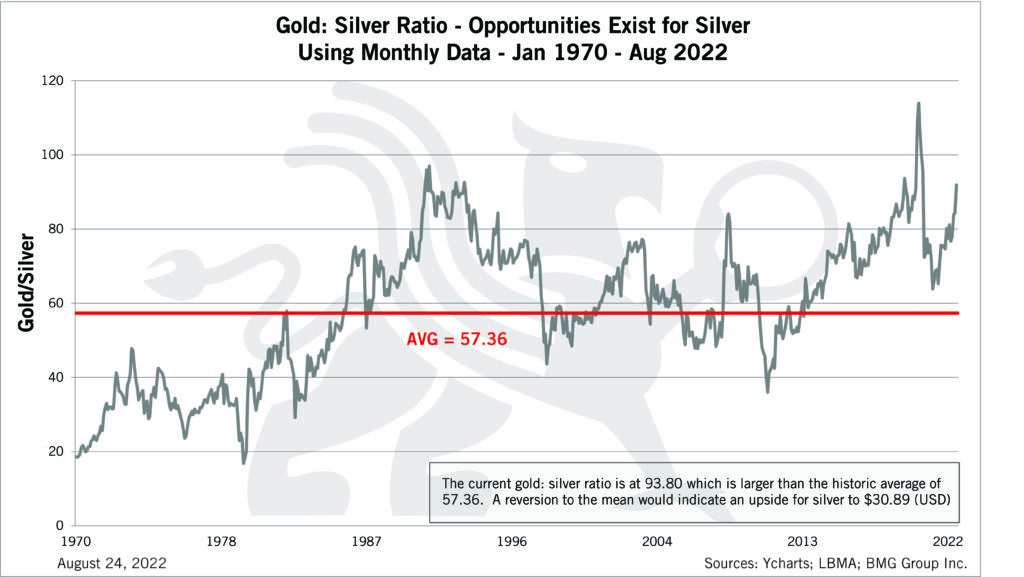
- At present, the gold/silver ratio is also trending toward the higher end of its historical range, although it hasn’t yet hit an extreme.
Agricultural commodities prices are well off the highs observed in 2022. However, that doesn’t mean there haven’t been good trading opportunities in this niche of the financial markets in 2023.
In fact, one such opportunity presented itself at the end of August, and market participants that pounced on an elevated soybean/corn ratio have undoubtedly seen their fortunes rise over the last six weeks.
Much like the gold/silver ratio, the soybean/corn ratio provides insight into the price of these two commodities relative to each other.
For example, the gold/silver ratio is calculated by simply taking the price per ounce of gold and dividing it by the price per ounce of silver. And the quotient of that equation reports how many ounces of silver are required to buy a single ounce of gold, at any given point in time.
During the last 20 years, the gold/silver ratio has ranged between about 40 and 120. And when the gold/silver ratio moves toward one of those extremes, investors and traders often use a spread trade that benefits when the gold/silver ratio reverts back toward its historical average, which is roughly 60.
For example, at the bottom end of the range, only 40 ounces of silver are required to purchase an ounce of gold. In relative terms, that indicates gold is fairly cheap, and in this case an investor/trader might pair buying gold versus selling silver—a trade that benefits as the gold/silver ratio moves back to its historical average.
On the other hand, when the gold/silver ratio spikes toward the other end of its historical range, that means that gold is expensive in relative terms. For example, if the gold/silver ratio increased to 100, that would indicate that 100 ounces of silver were required to purchase a single ounce of gold.
In this scenario, spread traders might deploy the opposite trade—selling gold while simultaneously buying silver. This pairs trade benefits when the price of gold falls more rapidly than the price of silver, pushing the gold/silver ratio back towards its historical average.
For reference, the gold/silver ratio is currently trading about 85 ($1,945/$22.90 = 85), which means it is currently sitting at the higher end of its historical range.
Analyzing the recent collapse in the soybean/corn ratio
Similar to the gold/silver ratio, investors and traders also utilize the soybean/corn ratio to assess the relative price of these two key agricultural commodities. Historically, the soybean/corn ratio ranges between roughly 2 and 3.
With soybeans currently trading $12.80/bushel and corn trading $4.94/bushel, that means the soybean/corn ratio currently stands at roughly 2.59 ($12.80/$4.94 = 2.59). That level is fairly close to the midpoint of the soybeans/corn ratio’s historical range—the metric has averaged about 2.51 over the last twenty years.
However, back on Aug. 30, the soybean/corn ratio climbed all the way up to 2.84. At that time, soybeans were trading around $13.70/bushel, while corn was trading about $4.82/bushel.
At 2.84, the soybean/corn ratio was trading near the upper end of its historical extreme, indicating that soybeans were relatively expensive compared to corn (illustrated below).
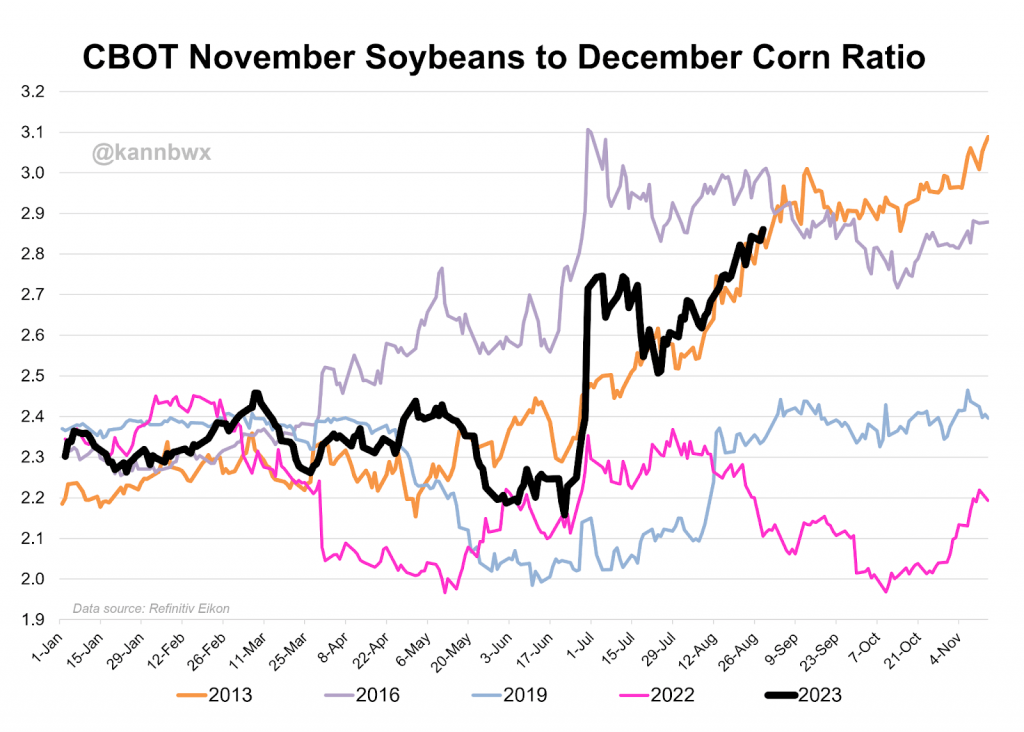
Assuming an investor/trader agreed with that perspective, and wanted to act on it, he might pair a short soybeans position with a long corn position.
Based on the last six weeks of trading activity, one can see how the aforementioned pairs trade worked to perfection.
Since Aug. 30, soybeans have declined in value by about $0.90/bushel ($13.70 – $12.80 = $0.90). On top of that, corn prices have actually appreciated during that same period, rising by about $0.12/bushel ($4.94 – $4.82 = $0.12).
In this particular instance, the spread trader that sold soybeans and bought corn benefited on both legs of the spread, as soybeans declined in value while corn increased in value. Certainly, that won’t happen on every occasion.
Since Aug. 30, the soybean/corn ratio has dropped from 2.84 back down to 2.59—just above the metric’s long-term average of roughly 2.51. One can see how that worked out advantageously for pairs traders that sold soybeans and bought corn.
It should be noted that just because the soybean/corn ratio moves to an extreme, that doesn’t mean the associated spread, pairs trade is guaranteed to win. In some cases, the soybean/corn ratio could move further away from its average, creating losses for the spread position. Or, it could simply sit still at that same level—essentially creating a break-even situation.
However, history has shown that over time the soybean/corn spread does revert toward its historical average. It’s just that in some cases, the investor/trading holding the associated spread position may have to suffer a drawdown in capital before it does so.
For this reason, pairs traders should have the capital reserves necessary to withstand short-term or and medium-term losses, because given enough time, these positions do often move back into positive territory.
In 2023, however, that wasn’t necessary, because after peaking in late summer, the soybean/corn ratio moved steadily lower, generating a positive return for those market participants that deployed the short soybeans and long corn spread trade back in late August.
It should be noted that because the soybeans futures contract is worth roughly twice the corn futures contract, this particular spread could be structured in 1×2 fashion, or even 1×3. That means that for every soybean contract traded, two or three corn contracts could be traded, which consequently helps to balance out the delta exposure on both legs of the trade.
The exact structure will depend on the outlook of the investor/trader in question, and whether or not he/she wants an equally balanced trade, or one that is biased toward one leg or the other.
To learn more about the basics of trading agricultural futures, readers can check out this helpful video on the tastylive financial network. Going forward, Investors and traders interested in pairs trading can monitor the gold/silver ratio, in the event it moves even higher in the coming weeks and months.
To follow everything moving the markets, including the options markets, tune into tastylive—weekdays from 7 a.m. to 4 p.m. CDT.
Andrew Prochnow has more than 15 years of experience trading the global financial markets, including 10 years as a professional options trader. Andrew is a frequent contributor Luckbox Magazine.
For daily financial market news and commentary, visit the News & Insights page at tastylive or the YouTube channels tastylive (for options traders), and tastyliveTrending for stocks, futures, forex & macro.
Trade with a better broker, open a tastytrade account today. tastylive, Inc. and tastytrade, Inc. are separate but affiliated companies.
Hungry for more? The next issue of Luckbox is food-focused looking at new growth opportunities and trading ideas in food, beverage, agricultural, hospitality and grocery stocks. Not a subscriber? Subscribe for free at getluckbox.com.