Silver Prices Are Up Nearly 35% in 2024. Here’s What You Need to Know.
Supply deficits and increased demand have contributed to a strong bull run in the silver market in 2024

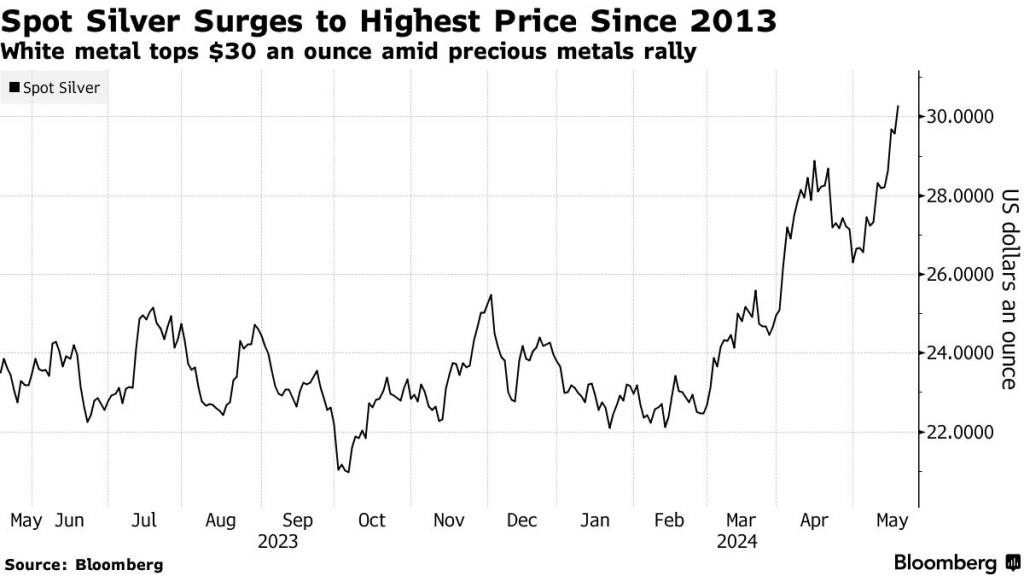
- Silver prices are up nearly 35% thus far in 2024, recently notching an 11-year high.
- The silver market benefited from favorable supply-demand dynamics, on top of rising expectations that the Federal Reserve will cut interest rates.
- The surge in silver prices has also pushed the gold/silver ratio back toward its long-term historical average.
Earlier this year, skyrocketing gold prices set the stage for a significant year in the precious metals market. And as summer approaches, that narrative remains intact, with gold prices currently trading at record highs, having surpassed the $2,400 per ounce mark for the first time in history.
However, the big story of late has been the silver market. Silver isn’t yet trading at record highs, but silver prices haven’t been this high in more than a decade.
On May 21, silver prices closed trading at approximately $32.00/ounce, representing a rally of nearly 35% since the start of the year. For reference, the all-time high in the silver market is closer to $50/ounce, suggesting that silver has significant room to run, if the rally is extended.
Silver hasn’t traded above $40 per ounce since the summer of 2011, the same year it last approached $50 per ounce. The only other time silver reached those heights was 1980, when two brothers—Herbert and Nelson Hunt—attempted to corner the silver market. That effort also pushed silver prices to nearly $50 per ounce, but the gambit failed, and silver prices ultimately crashed back below $10 per ounce.
2024 supply-demand dynamics in the silver market
Much like the gold market, there are several reasons that silver prices are moving higher in 2024. Like the gold market, many silver investors and traders view the potential for a U.S. rate cut as a good reason to own precious metals.
If a rate cut does materialize in 2024, that would theoretically weaken the U.S. dollar. Traditionally, that can provide a lift to valuations in the commodities markets. Lower interest rates reduce the opportunity cost of holding non-yielding assets like silver and gold, making them more attractive. Additionally, lower rates can spur inflation, against which precious metals are often viewed as a hedge.
On top of the above, other supply-demand dynamics appear to be giving a boost to the silver market. One of those is an expected supply deficit. Unlike gold, silver is used for various industrial uses, such as electronics, electric vehicles, and solar panels.
And in recent years the silver market has faced a supply deficit. Instead of freshly mined silver, some silver buyers have been forced to purchase existing silver out of storage. From 2021 to 2023, the Silver Institute estimates that the global silver deficit totaled roughly 474 million ounces, which equates to about 14,743 tons.
And as illustrated below, silver supply deficits are expected to extend through 2024, and likely beyond.
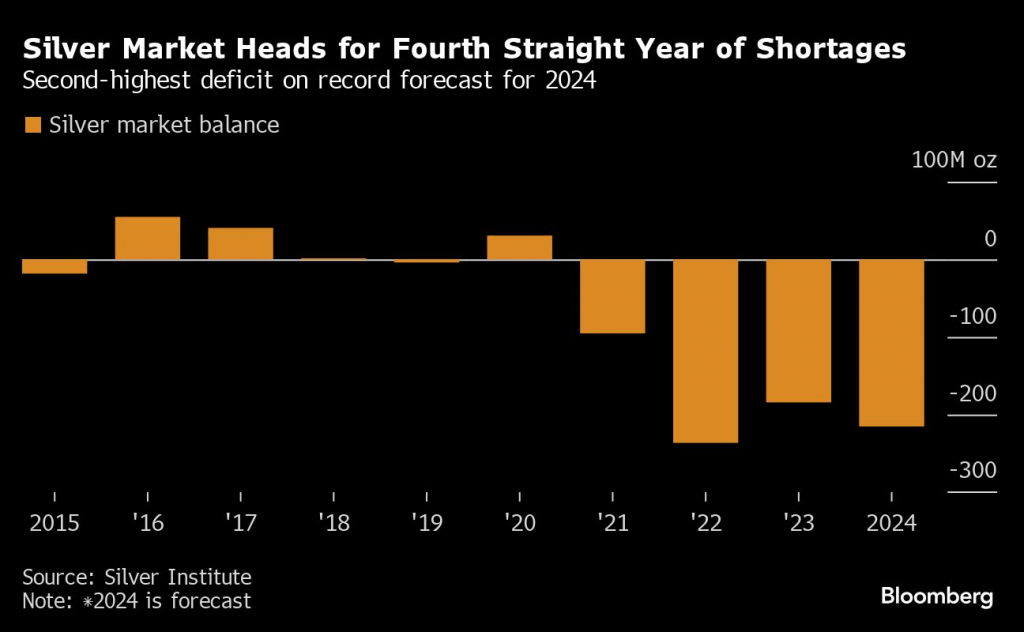
Importantly, the supply deficit isn’t the only factor driving silver prices higher in 2024. In addition to supply-side issues, the silver market has also experienced increased demand in recent years.
This year, the Silver Institute forecasts that silver demand will rise by 8%, climbing to nearly 632 million ounces. According to the silver institute, the bulk of the demand growth is attributable to the industrial sector. According to the Silver Institute’s World Silver Survey 2023, industrial applications account for more than 50% of the total silver demand, whereas only about 7% of total gold demand is attributable to the industrial sector.
Taken all together, it’s easier to understand why silver prices have been rising. Commodity prices are extremely sensitive to shifts in the supply-demand balance. In 2024, both sides of the equation are contributing to bullish sentiment in the silver market.
Silver’s correlation with gold, and the gold/silver ratio
Historically, gold and silver share a strong positive correlation. That means when one of these precious metals rises or falls in price, the other usually follows.
Over the long term, gold and silver share a strong, positive correlation between roughly 0.75-0.80. And that’s underscored by the fact that the SPDR Gold Trust (GLD) and the iShares Silver Trust (SLV) have exhibited a correlation of roughly 0.79 over the last 36 months.
Of course, this relationship can break down. When that occurs, many investors and traders in the precious metals market attempt to capitalize upon the situation.
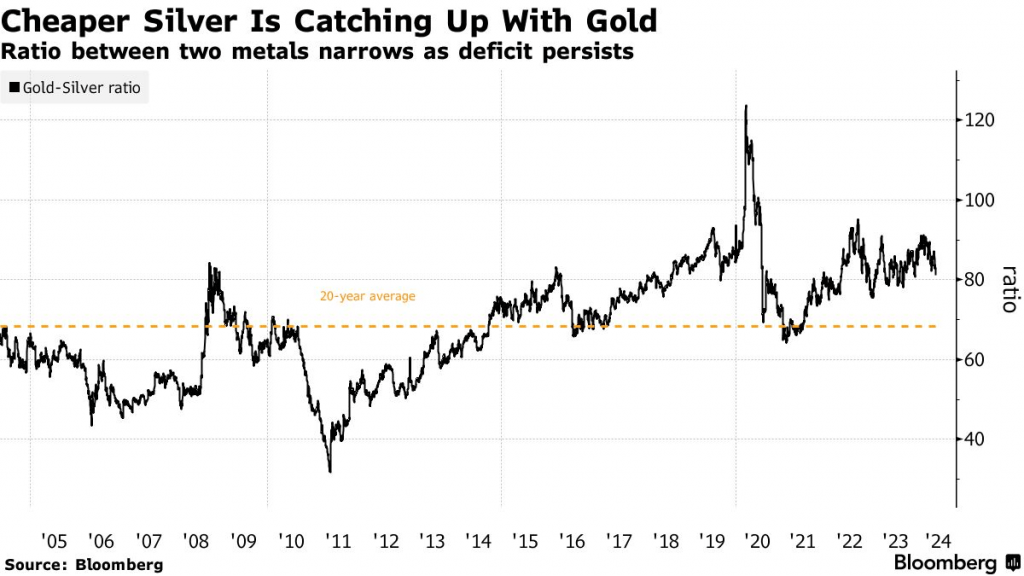
To track the ongoing price of gold, relative to that of silver, most market participants use the gold/silver ratio. The gold/silver ratio is therefore calculated by dividing the current price of gold by the current price of silver. The quotient of that equation reports how many ounces of silver are required to buy a single ounce of gold.
During the last 20 years, the gold/silver ratio has ranged between roughly 40 and 110. That means at its current level of 75 ($2,420/$32.00 = 75), the gold/silver ratio is hovering near the midpoint of its historical range.
Not too long ago, the gold/silver ratio was trading closer to 85, which indicated that silver prices were getting more attractive relative to gold prices. But silver has closed the gap, outperforming its close cousin in recent weeks, and consequently pushing the gold-silver ratio back towards its historical median.
Unfortunately, the gold/silver ratio is more useful as a potential trading indicator when the ratio hits an extreme. When that happens, it generally indicates that the relative values of the two metals have strayed from the historical mean. And in these instances, some investors and traders in the precious metals sector attempt to capitalize upon the opportunity.
Traditionally, pairs traders sell gold and purchase silver when the gold/silver ratio trends toward the upper end of its historical range. This combined pairs position theoretically benefits from a drop in the ratio—requiring gold to go lower, silver to move higher, or a combination of both. The opposite position is typically deployed (long gold, short silver) when the gold/silver ratio declines toward the lower end of its historical range.
At the current level of 75, however, the gold/silver ratio doesn’t provide a compelling reason to deploy either position.
For more background on the current dynamic in the silver market, readers can check out this installment of Futures Power Hour on the tastylive financial network. To access the silver market, readers can consider silver futures, as well as single stocks and ETFs levered to the silver market, such as the ABRDN Physical Silver Shares ETF (SIVR), the iShares Silver Trust (SLV), Coeur Mining (CDE), First Majestic Silver (AG), Fortuna Silver Mines (FSM), Pan American Silver (PAAS) and Wheaton Precious Metals (WPM).
Andrew Prochnow has more than 15 years of experience trading the global financial markets, including 10 years as a professional options trader. Andrew is a frequent contributor of Luckbox Magazine.
For live daily programming, market news and commentary, visit tastylive or the YouTube channels tastylive (for options traders), and tastyliveTrending for stocks, futures, forex & macro.
Trade with a better broker, open a tastytrade account today. tastylive, Inc. and tastytrade, Inc. are separate but affiliated companies.