Lessons From the Last Crisis: Gold Stocks
Whenever volatility spikes, as it has dramatically in 2020, some investors and traders park their money in perceived safe havens.
While gold is often viewed as one such safe haven, research conducted by tastytrade suggests otherwise—at least as far as how gold prices have historically performed when equity markets are tanking.
The conclusion of that research is that gold pretty much has a mind of its own.
This is illustrated in the graphic below, which highlights gold’s correlation—or lack thereof—with the S&P 500 since 2010. As one can see in the last row, gold futures (/GC) demonstrated almost zero correlation with the S&P 500 during the period analyzed:
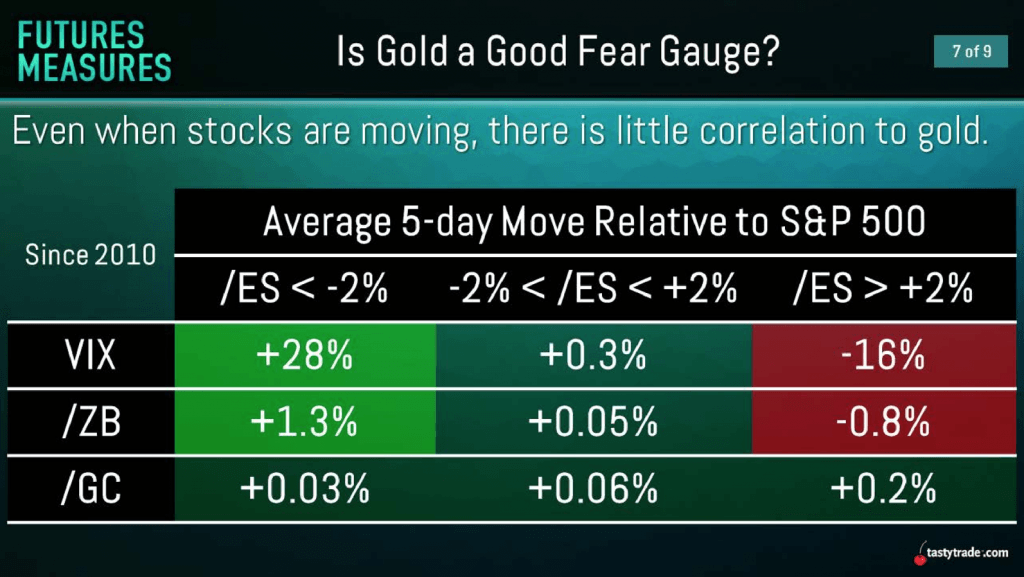
If gold were actually a safe haven when equity markets are crashing, one would expect to see a very high historical inverse correlation between gold and the S&P 500.
One can see in the above data that this hasn’t been the case.
When the S&P 500 has been down more than 2% (far left column), gold futures (bottom row) have exhibited a nearly zero correlation with equities—no discernible inverse correlation (move together, but in opposite directions) and no discernible positive correlation (move together in the same direction).
In terms of gold’s status as a safe haven, the recent crash in equity prices associated with the spread of the coronavirus has provided another opportunity to evaluate this topic.
And as most investors and traders have likely observed, the price of gold actually went down as the selloff in equities intensified. Once again, if gold were truly a safe haven, one would expect to see something different.
From Feb. 20 to March 19 of this year, the S&P 500 declined by about 30%, and during that same period gold prices were roughly 15% lower.
Market participants hoping to make money by being long gold during the recent wave of volatility were likely disappointed to see their gold holdings drop in value right along with equities.
Taking a closer look at the gold sector, one finds that the gold mining niche of the stock market also took a big hit during the recent selloff. Listed below are some of the largest capitalized gold mining stocks and their associated performance as the market sold off from Feb. 20 to March 19:
- Agnico Eagle Mines (AEM): -24%
- AngloGold Ashanti: (AU): -25%
- Barrick Gold (GOLD): -24%
- Freeport-McMoRan (FCX): -53%
- Gold Fields (GFI): -42%
- Newmont Goldcorp: -20%
Gold miners are somewhat unique because they almost have split personalities—being partly exposed to the underlying price of gold and partly exposed to the general direction of the stock market. The former because they mine gold and sell it, thus relying on healthy gold prices, and the latter because they are publicly traded stocks (they exist in the “equity” asset class).
Citing additional research conducted by tastytrade, the split personality in gold miners (GDX) can also be confirmed using historical trading data. This duality is illustrated in the two slides below:
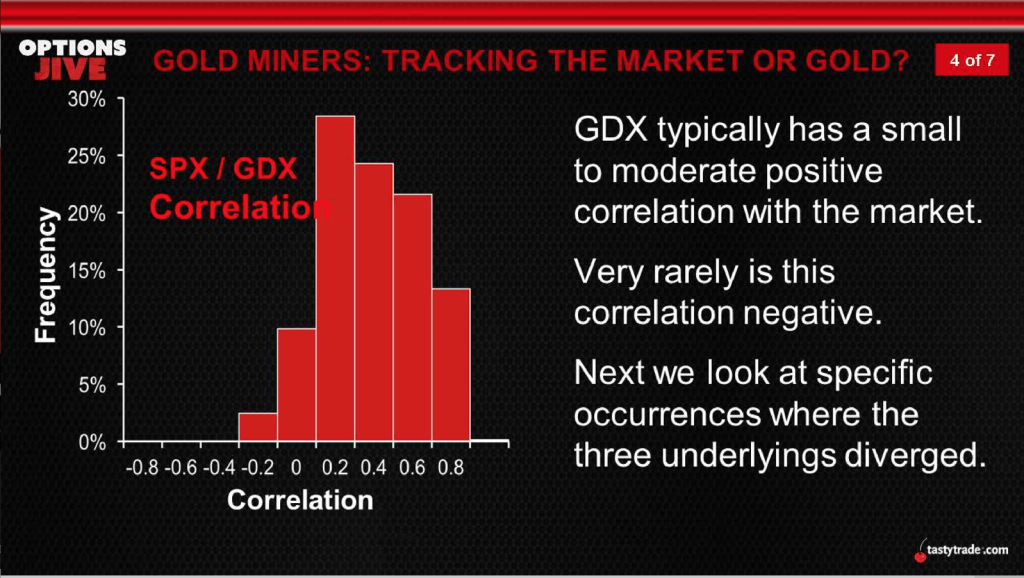
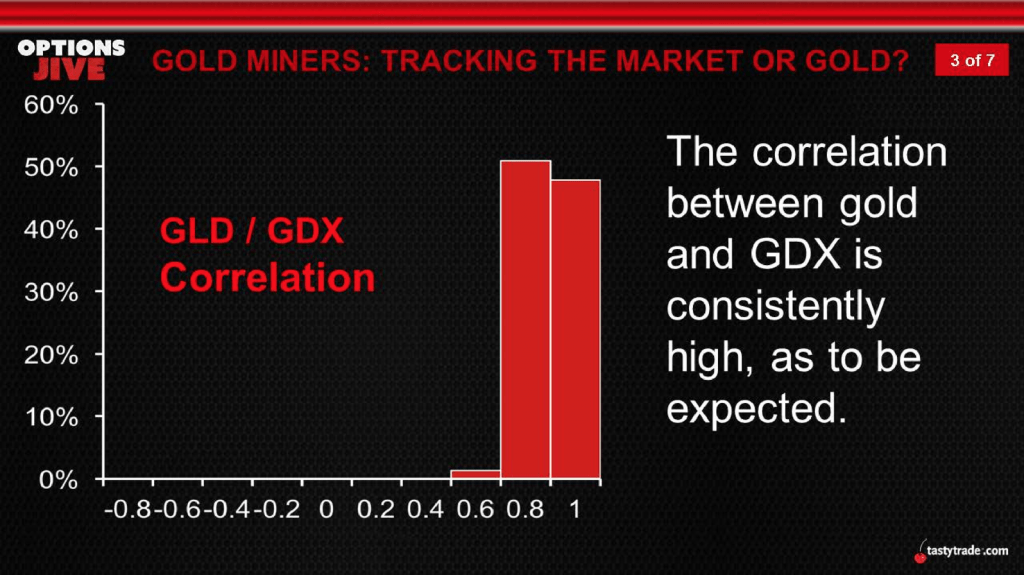
The first slide illustrates how gold miners’ correlation with the overall stock market tends to shift across a range of relationships (positive, negative and none), while leaning toward slightly positive on average. The second slide demonstrates how the gold miners exhibit a very strong positive correlation with physical gold (GLD).
These characteristics do hold with what’s been observed so far during the equities correction in 2020.
As the equities correction has intensified, gold miners exhibited positive correlation and followed the markets lower. The first image above indicates that this is congruent with historical data.
However, one also has to consider that physical gold has spiraled lower. Given the strong positive correlation between physical gold prices and the gold mining stocks (as shown in the second slide above), the drop in gold mining stocks must therefore also be partially explained by movement in the underlying gold market.
In sum, it seems that the combined gravity of corrections in equities and physical gold markets exacerbated the downward draft in mining stocks. In that sense, gold miners basically got hit with both barrels of the shotgun.
Intriguingly, historical trading data from the last pronounced financial crisis in global markets (2008-2009) reveals a similar trend.
Amid the Great Recession, gold prices and gold mining stocks both declined when broader equity markets tanked in 2008-2009, much like what has been observed in 2020.
And while there’s never any guarantee that history will repeat itself in the future, it seems that so far, in this instance, a repeat has indeed been the case.
Given all of the above, the real rub comes from the next state of the analysis—the performance of gold prices, gold miners and the overall stock market after hitting rock bottom in 2009.
When the S&P 500 finally found its footing in the wake of the crisis, and bounced off the bottom, so too did gold prices and gold mining stocks. All three groups rallied significantly in the aftermath of the crisis.
This phenomenon may be attributable to a third spoke on the wheel of gold correlations: gold’s relationship with the U.S. dollar. Gold and the dollar are often viewed as inversely correlated—as one goes up, the other goes down, and vice versa.
So when the Federal Reserve cut interest rates to zero during the Great Recession, the value of the dollar in turn declined, thus setting the stage for a rally in gold. It should be further noted that rates remained near zero for a long time (seven years), and that gold rallied for the first few years of that period.
These historical developments therefore beg the question of whether physical gold and the gold mining stocks will rally once again after the current downturn in equities hits bottom.
There’s obviously no guarantee that history will repeat itself, but based on some compelling historical evidence—and considering current market conditions—there’s reason to believe that both physical gold and the gold mining stocks will rally whenever the broader equity market starts to recover.
Only time will tell, but this might be a theme to keep an eye on in the coming days, weeks and maybe even months, ahead.
To learn more about the topics discussed in this post, readers may want to review the complete episode of Options Jive on the tastytrade financial network when scheduling allows.
Sage Anderson is a pseudonym. The contributor has an extensive background in trading equity derivatives and managing volatility-based portfolios as a former prop trading firm employee. The contributor is not an employee of Luckbox, tastytrade or any affiliated companies. Readers can direct questions about topics covered in this blog post, or any other trading-related subject, to support@luckboxmagazine.com.