Mean Reversion and Optimal Trade Entry
With equity markets in correction mode at the start of October, current market conditions are opening up plenty of new opportunities on the short side of the volatility coin.
And if you want to learn more about the potential of short volatility, or rather the power of falling implied volatility, then a new episode of Market Measures on the tastytrade financial network should make for timely viewing.
The theme of this particular installment of the show is falling implied volatility—how often it occurs and how significantly it can impact the P/L of short premium positions. Data presented on the show will undoubtedly help traders better visualize the power of falling implied volatility.
It should be noted that hosts of the show frequently reference two popular volatility trading terms—implied volatility and implied volatility rank (IVR). Traders seeking to explore in greater detail the definitions and market applications of these terms may want to first review a recent episode of Where Do I Start?
Circling back to Market Measures, the first major question investigated on the show relates to the VIX. In order to better understand how movement in the VIX impacts short premium positions, the Market Measures team designed a market study which backtested a simple short premium strategy in SPY.
The goal was to specifically examine how the position performed when the VIX went up during the lifetime of the position, as compared to when the VIX went down during the lifetime of the position. The strategy backtested was a simple 16-delta strangle in SPY, using data from 2005 to present.
To produce the results necessary for the aforementioned analysis, the historical trading data was parsed into two specific groups.
The first group included trades that saw a decrease in the VIX over the lifetime of the trade, and the second group included trades that saw an increase in VIX over the lifetime of the trade. The purpose of isolating these two environments was to try to better understand whether there exists a difference between “favorable” conditions (i.e. falling implied volatility) when trading short volatility as compared to “unfavorable” conditions (i.e. rising implied volatility).
The results of this study are summarized in the graphic below.
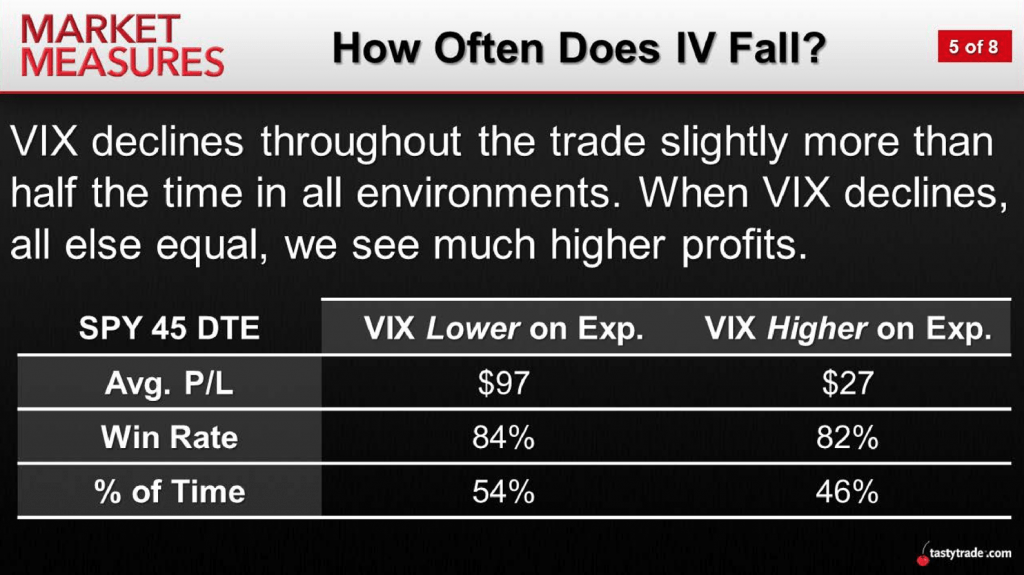
As one can see in the above data, the short strangle clearly performed better when the VIX decreased during the life of the trade.
However, one interesting facet of the results was the fact that the short strangle still managed to produce a positive profit (on average) even when the VIX went up during the life of the trade. This takeaway serves as great reinforcement of implied volatility overstatement in the market.
While the above data is interesting, it’s the second phase of the research that really drives home the power of falling implied volatility—and may even help guide traders going forward in terms of selecting desired entry points for short premium trades.
In the second phase of the analysis, the Market Measures team used implied volatility rank as the primary metric by which the results were parsed. So instead of looking at whether the VIX went up or down during the lifetime of the trade, the intent was to discover how often implied volatility declined during the lifetime of the trade based on the IVR entry point.
After all, a decline in implied volatility is one of the primary goals when entering a short premium trade.
In this phase of the study, trades were grouped according to whether IVR was greater than 20, greater than 30, greater than 40, or greater than 50 at the time of trade entry. The results of this second analysis are highlighted in the slide below.
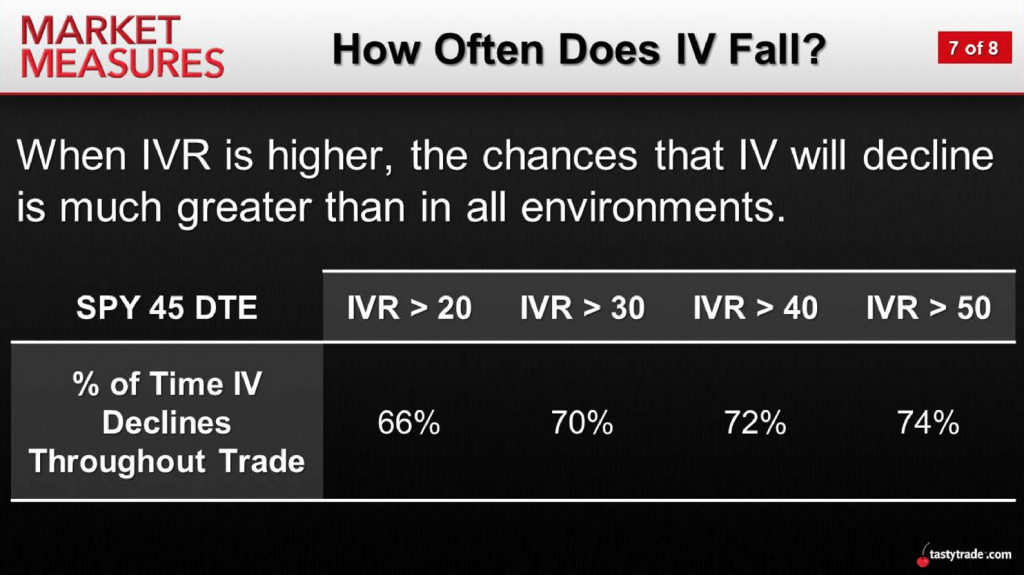
The information in the graphic above clearly illustrates that a positive correlation exists between the absolute level of implied volatility rank (when used as a signal for trade entry) and the percent of time that implied volatility declines during the lifetime of a given trade.
As IVR increases, so too does the likelihood that implied volatility will fall during the life of the trade.
With the VIX recently popping back above its historical mean of roughly 18 (currently trading 20+), there’s no doubt that implied volatility rankings will also have increased substantially across the board.
Traders embracing the short premium philosophy may therefore want to stay alert for attractive entry points in the coming days and weeks. This is especially true due to the fact that volatility spikes in the last several years have been mostly short-lived.
Sage Anderson is a pseudonym. The contributor has an extensive background in trading equity derivatives and managing volatility-based portfolios as a former prop trading firm employee. The contributor is not an employee of luckbox, tastytrade or any affiliated companies. Readers can direct questions about topics covered in this blog post, or any other trading-related subject, to support@luckboxmagazine.com.