Does Volume Predict Future Price Direction?

When trading in the financial markets, it’s typically advantageous to target positions with high liquidity.
High liquidity helps ensure that pricing in a given market is efficient, providing the best possible execution prices for investors and traders. Likewise, liquidity is critical because market participants generally seek to exit positions as easily as they enter them.
When markets make extreme moves, as observed during the spring of 2020, liquidity can dry up, making it harder to execute trades at the prices indicated by the market. By targeting positions and products with extremely high liquidity, there’s generally a better chance of exiting those positions at the desired price.
While most savvy market participants monitor liquidity for the above reasons, there’s also a group of investors and traders who follow liquidity (also referred to as “volume”) because they believe it can be a useful indicator of price direction.
Using volume (or changes in volume) as an indicator of future price direction falls under the “technical” school of investment philosophies. So-called technical analysts, or market technicians, analyze potential investments or trades based on past market prices and other technical indicators.
Market participants embracing technical analysis generally believe that short-term price movements are the result of supply and demand forces in the market. This practice involves using technical indicators such as price, volume and open interest, to guide decision making.
Investors and traders can decide for themselves whether the overall technical approach to decision-making fits their strategic outlook and risk profile.
That aside, the notion that volume can be predictive of price is slightly dubious based on research conducted by the tastytrade financial network. To clarify, liquidity itself is a very important statistic to monitor for the aforementioned reasons of price efficiency and trade execution.
It’s the question of whether volume is ultimately predictive of price direction that researchers at tastytrade put under the microscope on a recent episode of Tasty Extras.
In order to provide the necessary data to evaluate this question, tastytrade examined the price histories of four well-known equities: SPY, AAPL, TSLA and NFLX. Next, this price data was backtested to evaluate whether a pattern could be discerned that indicated a reliable, consistent relationship existed between volume indicators and price direction.
As shown in the two graphics below, this research revealed virtually no evidence of statistical significance existing between the daily change in volume and price direction (basically a zero correlation).
Moreover, isolating historical trading data in those four symbols to exclusively include days when there were spikes in volume revealed the same thing: virtually zero correlation. These findings are summarized in the slides below:
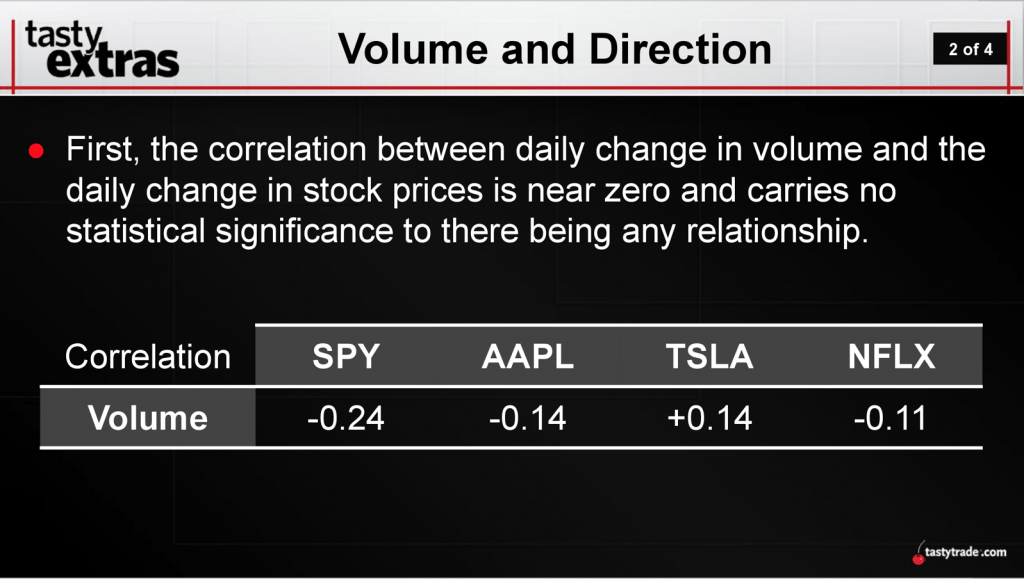
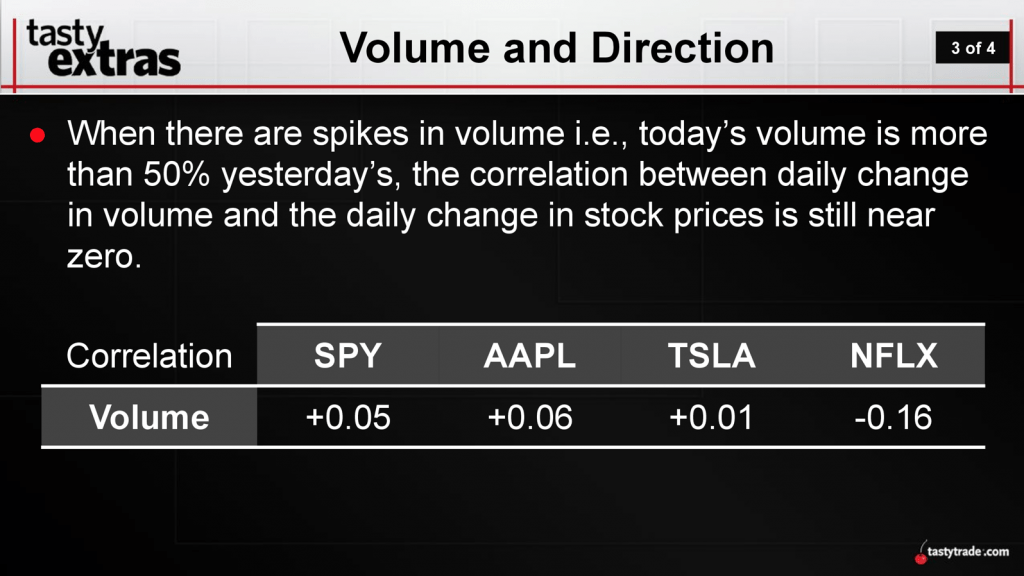
While market participants using technical analysis in their decision-making may have found a method that produces consistent profits, it appears from the data shown above that these results don’t hinge on a discernible historical relationship between volume and price direction.
Certainly, because the field of technical analysis is so broad, there may be a combination of factors—including an individual’s unique outlook and instincts—that does produce consistent, repeatable results.
Because of the lack of statistical significance in the volume-price direction relationship, it’s possible that market participants might seek additional insights that could prove more useful in practical application.
One such reality is the existence of what is typically referred to as “positive drift” in equity indexes. In the stock market, positive drift is a term that refers to the gradually rising nature of stock prices over time.
Using data from the S&P 500 going back to 1950, the tastytrade team examined historical price data to evaluate whether any noticeable patterns emerged. As it turns out, positive drift does appear to exist, given that the number of “up” days in the S&P 500 did outnumber “down” days during the period examined:
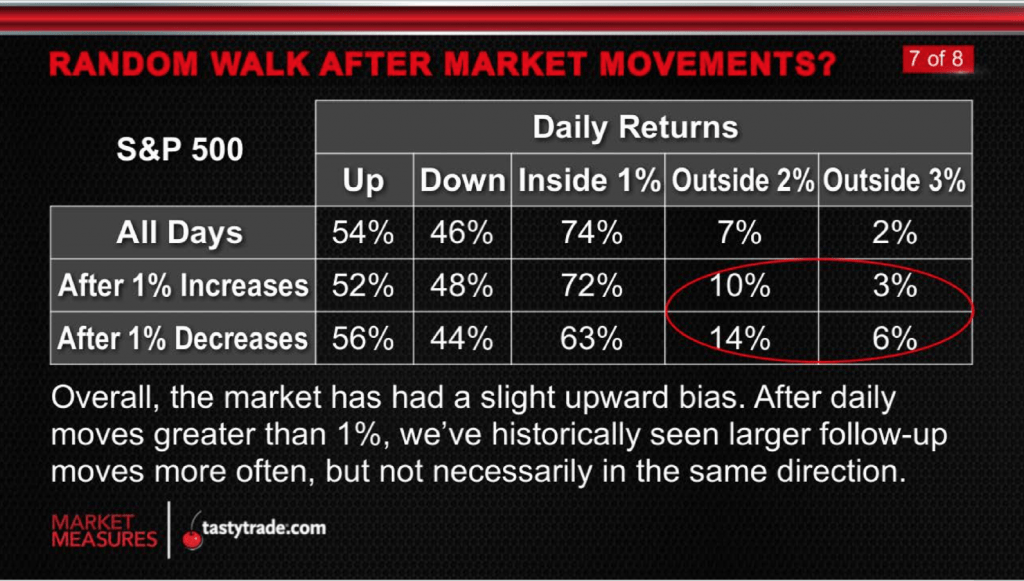
The statistics above support the notion of positive drift, as the S&P 500 has experienced more up days than down days over the last 70 years. Obviously, the S&P 500 has also steadily risen over time, which is another verification of positive drift.
To supplement this material, tastytrade has also examined the historical behavior of the S&P 500 (SPY) as it relates to consecutive “up” days and consecutive “down” days.
For further insight on how the SPY has performed historically from this perspective, readers may want to review the following episodes when scheduling allows:
Sage Anderson is a pseudonym. The contributor has an extensive background in trading equity derivatives and managing volatility-based portfolios as a former prop trading firm employee. The contributor is not an employee of luckbox, tastytrade or any affiliated companies. Readers can direct questions about any of the topics covered in this blog post, or any other trading-related subject, to support@luckboxmagazine.com.


