Using Options to Estimate a Stock’s Expected Move
“Expected Move” refers to the market’s expectation for future movement in a given underlying, and this simple calculation can be used by market participants to analyze new trading ideas for the portfolio.

When considering a new position for the portfolio, most investors and traders conduct a scenario analysis to determine the potential risks and rewards of the position before deploying it “live” in the market.
To assist with the scenario analysis process, market participants may want to consider using the options market to gain further insight into the market’s expectation for a given position.
Of course, this exercise requires that the position in question has associated options. For many equity and futures products, that will often be the case.
Apple (AAPL) stock, for example, has associated equity options, which makes it a good candidate for this type of analysis.
Therefore, in order to ascertain the market’s expectation for forthcoming movement in Apple stock, one simply needs to pull up the options market for the time period under consideration.
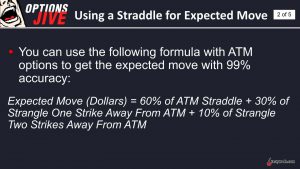
Using current options prices in the market, one can then ascertain the market’s expected move using the following formula: Expected Move = 60% of at-the-money (ATM) straddle + 30% of the strangle one strike from ATM + 10% of the strangle two strikes from ATM.
As a reminder, a straddle involves the ATM call and put for options expiring in the same period. When the call and put are sold simultaneously, the associated position is referred to as a “short straddle,” and when both are purchased, it is referred to as a “long straddle.”
Alternatively, a strangle is constructed by trading two different options (a put and call) with different strikes, but in the same expiration period. When deploying a long strangle both options are purchased, while a short strangle involves selling both options.
In the case of the expected move, the above straddles and strangles simply serve as reference points used in the calculation. And using those reference points, it’s possible to calculate a real-world example.
At present Apple (AAPL) stock is trading right around $180, which means the ATM strike price—defined as the closest strike price to the current market price of the underlying—is also $180.
In terms of the strangles, the next closest strikes are the $177.5 put and the $182.5 call, while the second-closest strikes are the $175 put and the $185 call. The current market prices of all those calls and puts in the regular January 2022 monthly expiration are listed below:
- $180 strike call = $4.63
- $180 strike put = $5.10
- $177.5 strike put = $3.93
- $182.5 strike call = $3.53
- $175 strike put = $3.02
- $185 strike call = $2.65
Using the above figures, one can now calculate the market’s expected move for AAPL through the January 2022 monthly options expiration, which occurs on Jan. 21, 2022.
As referenced previously, the expected move is calculated by adding together the following values: 60% of ($4.63 + $5.10), 30% of ($3.93 + $3.53) and 10% of ($3.02 + $2.65).
The final calculation therefore reads: (0.60 x $9.73) + (0.30 x $7.46) + (0.10 x $5.67), which is equal to $5.84 + $2.24 + $0.57, or a total of $8.65.
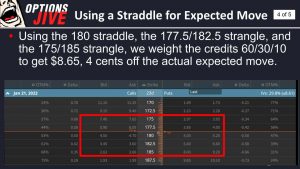
The above means that through Jan. 21, 2022, the market’s cumulative expectation for AAPL indicates a range of +/-$8.65 of $180, or between $171.35 and $188.65.
Of course, there’s no guarantee that AAPL stock will behave as expected, because future movement can’t be predicted. This figure simply reflects the market’s current expectations for movement in AAPL stock over the indicated timeframe.
But there’s still value in this figure, because it does provide important insight into the market’s expectations for AAPL stock, as well as the current risk environment. Moreover, the fact that actual moves in most underlyings tend to fall within the expected move is one of the foundations of the short options/volatility trading approach.
For example, previous research conducted by the tastytrade financial network demonstrated that the actual move in the SPDR S&P 500 ETF Trust (SPY) has historically been significantly lower than the expected move.
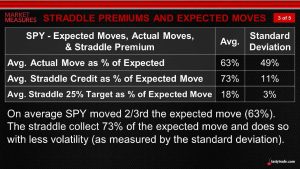
To learn more about the short options/volatility approach in the context of expected moves, readers can review this past installment of Market Measures on the tastytrade financial network. More information on the expected move concept is also available via this new installment of Options Jive.
For timely updates on everything moving the financial markets in 2022, readers can also tune into TASTYTRADE LIVE—weekdays from 7 a.m. to 4 p.m. CST—at their convenience.
Sage Anderson is a pseudonym. He’s an experienced trader of equity derivatives and has managed volatility-based portfolios as a former prop trading firm employee. He’s not an employee of Luckbox, tastytrade or any affiliated companies. Readers can direct questions about this blog or other trading-related subjects, to support@luckboxmagazine.com.


