Big Downer: Managing Major Market Corrections
As fear builds in the stock market, the stampede to buy puts can set off a chain reaction in the marketplace that can exacerbate the down move—creating that so-called “explosive” feeling that often accompanies corrections.
On April 22, the S&P 500 crashed nearly 3% in a single day, and after rebounding slightly on April 24, proceeded to drop another 2.8% on April 25.
The S&P 500 is now trading back near its low of the year, at 4,175—representing a 13% drop from the start of the year.
It will be important to pay attention to whether this relatively minor correction will develop into something more serious. Dating back to 1946, there have only been 12 trading years in which the major market indices dropped by more than 20%.
Down moves of 20% or more are typically referred to as bear markets. The last 12 bear markets are listed below, as well as the year-to-date returns in the S&P 500 in 2022:
- May 1946 (-21%)
- June 1948 (-20%)
- October 1957 (-21%)
- June 1962 (-28%)
- October 1966 (-22%)
- May 1970 (-36%)
- October 1974 (-48%)
- August 1982 (-27%)
- December 1987 (-33%)
- October 2002 (-49%)
- March 2009 (-57%)
- March 2020 (-34%)
- March 2022 (-13%, year-to-date)
If the S&P 500 were to drop down to 3,800 at some point before the end of the year, that would represent the 13th major market correction since 1946 (and second since the start of 2020).
With the S&P 500 currently hovering around an important level of support, the next chapter of the 2022 stock market story will likely be written in the near future. Either the market bounces back off that level of support, or it finally crashes through.
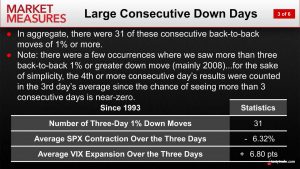
Previous research conducted by tastytrade has shown that when the S&P 500 drops by more than 1% during three consecutive trading days, the third day of losses tends to be the most severe.
Going back to 1993, the S&P 500 has only dropped by more than 1% on three consecutive trading days on 31 occasions, and the bulk of those were observed in 2008.
The above pattern isn’t applicable to the most recent three trading days in 2022 because the S&P 500 dropped during only two of the last three trading days, as opposed to three days straight. But considering current sentiment, a three day streak could materialize in the near future.
It’s also important to highlight that down days in the stock market can be exacerbated by the knee-jerk reactions of market participants, as outlined on a recent episode of The Skinny on Options: Abstract Applications.
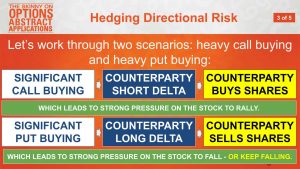
On this show, the hosts outline how fear in the marketplace can exacerbate selloffs, as market participants stampede to purchase protection (i.e. puts), and in turn force counterparties of those transactions to sell (or short) additional shares of stock.
The first part of that equation isn’t difficult to understand. When prices explode downward, fear overtakes some market participants, and they express that fear by purchasing puts. But those put purchases create a domino effect, because market makers on the other side of those transactions must risk-manage accordingly, as their inventory of short puts grows larger.
Market makers rarely hold naked option positions, instead opting to hedge their options portfolios with underlying stock to help protect against adverse moves.
So if a market maker sells 1 put contract, he or she will typically sell 20-80 shares of stock (per contract) to “delta hedge” the position. Collectively, this process is known as “delta neutral trading.”
Delta neutral hedging refers to a trading approach/strategy where the delta exposure (directional bias) of an options position is reduced through an offsetting position in the underlying security. A delta neutral trader seeks to isolate the theoretical edge from volatility (i.e. mean reversion), while minimizing the directional bias of the portfolio.
Considering those mechanics, it’s easier to understand why a down move in the markets can be exacerbated by “fear.” As more puts are purchased, more stock is being sold (or shorted) to account for growing risks to the downside.
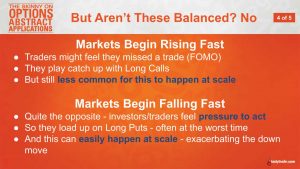
One also has to keep in mind that liquidity in the markets also can dry up during explosive down moves. That situation can also serve to push prices lower, as market participants are forced to lower their offers in order to find the required levels of liquidity.
In the reverse scenario, when markets are rallying, liquidity usually remains robust, which is why upward moves in the market tend to be less “explosive,” as compared to down moves.
To learn more about the mechanics of explosive down moves in the stock market, readers are encouraged to review a recent installment of The Skinny on Options: Abstract Applications on the tastytrade financial network. For more information on delta neutral hedging, this episode of Options Jive is also recommended.
For updates on everything moving the markets, readers are encouraged to tune into TASTYTRADE LIVE, weekdays from 7 a.m. to 4 p.m. CDT.
Sage Anderson is a pseudonym. He’s an experienced trader of equity derivatives and has managed volatility-based portfolios as a former prop trading firm employee. He’s not an employee of Luckbox, tastytrade or any affiliated companies. Readers can direct questions about this blog or other trading-related subjects, to support@luckboxmagazine.com.