Dividends, Yields and Payout Ratios
Dividends can be a great addition to the portfolio, but investors and traders active in this area may also want to monitor associated metrics such as dividend yields and dividend payout ratios.

Dividends can be a great addition to the portfolio, but investors and traders active in this area may also want to monitor associated metrics such as dividend yields and dividend payout ratios.
“Yield” is a somewhat misunderstood term in the investments and trading industry because it can be applied in different contexts. In general, however, yield refers to the amount of earnings produced from a given investment over a set period of time, and is expressed in percentage terms.
When it comes to dividends, the term “dividend yield” therefore refers to the earnings generated from dividends relative to the price of the underlying shares. Dividend yield is calculated by adding together all dividends received in a fiscal year, dividing that figure by the current share price and then multiplying by 100.
For example, a stock paying a quarterly dividend of $0.20 ($0.80 annually) with an underlying share price of $20 would have a 4% associated dividend yield. That figure is calculated by simply dividing $0.80 by $20 and then multiplying by 100 ($0.80/$20.00 = 0.04 x 100 = 4%).
As a reminder, dividends are basically rewards or bonuses paid by a company to its shareholders. When companies make profits they usually retain that cash for ongoing and future business activities, but larger companies at times also pay out profits in the form of dividends.
Some of the well-known, long-time dividend payers in the stock market include Coca-Cola (KO), ExxonMobil (XOM) and McDonald’s (MCD). Dividends are most frequently paid in cash, but may also be paid in the form of additional shares of stock, or even property (in rare cases).
Dividends can be paid regularly (i.e. quarterly or annually) or in irregular fashion (i.e. a special dividend). Listed below are some of the most common dividends:
- Cash dividends: Involves a direct cash payment to shareholders.
- Stock dividends: Instead of cash, shareholders receive additional shares of stock.
- Dividend reinvestment program (DRIP): DRIPs involve the reinvestment of dividends received back into the company’s stock, typically at a discount.
- Special dividends: These are special (i.e. nonrecurring) payments to shareholders, typically in the form of cash, and arise when a company has accrued larger than expected profits.
- Preferred dividends: Much like regular dividends, but only paid to owners of preferred stock.
Circling back to dividend yield, investors and traders should be aware that yields fluctuate based on two primary forces—the dividend amount and the underlying price of the shares. And ultimately, any changes to the dividend or the share price, will affect the dividend yield.
Going back to the previous example, imagine a company’s stock is trading for $20 and the company pays an $0.80 annual dividend—equating to a 4% dividend yield. Now imagine that stock rises from $20/share to $30/share. The new dividend yield would be 2.66% ($0.80/$30 = 0.0266 x 100 = 2.66%).
Alternatively, if the stock price in the company dropped from $20/share to $15/share, the dividend yield would increase from 4% to 5.33% ($0.80/$15 = 0.0533 x 100 = 5.33%).
Looking at another example, imagine that the size of the dividend increases, but that the underlying share price remains the same. So if the company increased the annual dividend from $0.80 to $1.00, then the dividend yield would increase from 4% to 5% ($1.00/$20 = 0.05 x 100 = 5%).
As illustrated by these examples, rising dividend yields can be deceptive. This may be due to an increase in the amount of dividend paid out to shareholders, but it can also be due to a decline in the underlying shares. The same can be said for a declining dividend yield, which may be due to a reduced dividend payout, or an increase in the value of the underlying shares.
It should be noted that conservative dividend investors tend to prefer dividend stocks with long track records. Moreover, it can be a red flag if a stock’s dividend yield is too high.
To better analyze a company’s dividend policy, market participants can also review the dividend payout ratio. This metric provides insight into the amount of money paid out in dividends relative to the company’s profits.
The dividend payout ratio is calculated by simply taking total dividends paid and dividing that figure by net income. So if a hypothetical company paid out $80 million in dividends and had a net income of $80 million, the dividend payout ratio would be 100% ($80 million/$80 million = 1 x 100 = 100%).
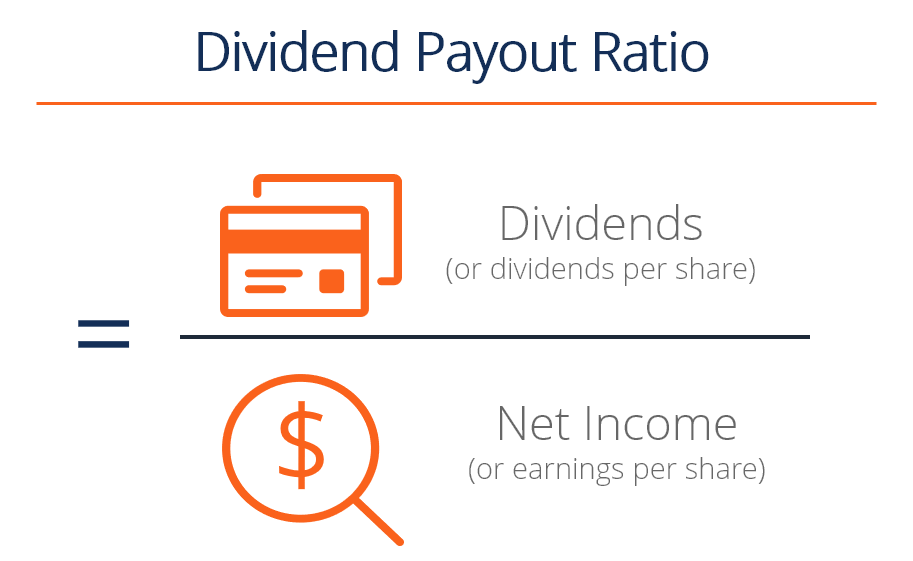
Source: Corporate Finance Institute
Generally speaking, investors tend to prefer dividend payout ratios that are 80% or below. That figure is generous to shareholders, and also indicates a company is able to keep some profits for reinvestment in its own operations.
If the dividend payout ratio exceeds 100% or is negative, meaning net income is negative, that may indicate that a company is borrowing to pay dividends, or that it isn’t producing enough true profit. In either case, such dividends have a higher risk of being cut.
Dividend payout ratios are typically well publicized and easily reviewed by market participants, much like dividend yields. And this information should better equip investors and traders to more efficiently monitor and understand the everchanging dividend landscape.
Dividends also play a role in the pricing of equity options, and market participants seeking to learn more about that topic may want to review this previous installment of From Theory To Practice: Dividend Math on the tastytrade network.
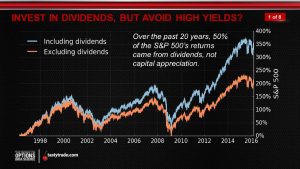
To learn more about dividend yields, readers can tune into this previous installment of The Skinny on Options: Avoiding High Yields.
Sage Anderson is a pseudonym. He’s an experienced trader of equity derivatives and has managed volatility-based portfolios as a former prop trading firm employee. He’s not an employee of Luckbox, tastytrade or any affiliated companies. Readers can direct questions about this blog or other trading-related subjects, to support@luckboxmagazine.com.