Hedging Earnings Risk
Event risk spikes during earnings season, but investors and traders can utilize hedging to ensure that the risks are minimized.

After a relatively benign start to the summer, volatility in the markets finally popped on July 19—prior to the start of Q2 earnings season.
The Dow Jones industrial average dropped nearly 1,000 points that day, which in turn helped push the CBOE Volatility Index (VIX) to two-month highs. And with a bevy of key players from the technology sector set to report earnings next week, the volatility may not be over anytime soon.
During the last week of July, many of the market’s best-known companies will be reporting results from Q2, starting with Tesla (TSLA) on July 26.
A day later, on July 27, Alphabet (GOOG), Apple (AAP) and Microsoft (MSFT) will all follow suit. Facebook (FB) and Qualcomm (QCOM) are set to report on July 28, while Amazon’s (AMZN) Q2 2021 results will be released on July 29.
Each quarterly earnings period is critical on the calendar because these financial data dumps provide investors and traders with key insights into the current business landscape, as well as fresh projections on future growth and profitability.
The uncertainty surrounding earnings season tends to attract event-focused market participants, as many hope to capitalize on big opportunities—particularly as it relates to options markets.
In options markets, earnings events often stand out because prices tend to be higher in months that cover an earnings release. This can usually be discerned by analyzing the implied volatility of options in an expiration month that captures an earnings event, as compared to an expiration month that does not capture earnings.
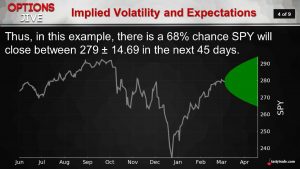
While options are priced in dollars and cents in the marketplace, these values can be reverse-engineered to produce a value known as implied volatility, which essentially represents the market’s expectation for future movement in the price of a given underlying.
Looking at an example, imagine that implied volatility in the SPDR S&P 500 ETF (SPY) is 15%. That means that over the next year, SPY would be expected to close between 15% up and 15% down from the current price. According to standard deviation theory, this has a 68% chance of occurring.
Options traders often filter for opportunities in which they believe implied volatility is too expensive or too cheap—meaning they think a given underlying will trade in a tighter or more narrow range than indicated by implied volatility.
To filter for such opportunities, market participants can use metrics such as tastytrade’s Implied Volatility Rank (aka IV Rank).
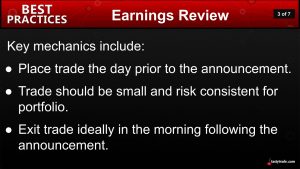
This same strategic approach can also be used when trading earnings events. However, market participants often tweak the strategy slightly for such positions. During earnings, a trader might analyze the price of the straddle in the earnings month to ascertain the expected move of a given underlying on earnings.
For example, if hypothetical stock XYZ is trading at a price of $100 the day before earnings, and the straddle with one day to expiration can be bought or sold for $5 the day before earnings, that means the market is expecting a 5% move on earnings day ($5/$100 = 5%). On the other hand, if the same stock XYZ had a straddle price of $20 the day before earnings, that would mean the market was expecting a 20% move on earnings ($20/$100 = 20%).
Even new traders can quickly recognize the vast gulf between the market’s expectations for earnings in these two hypothetical scenarios. If a trader saw an opportunity in the 20% scenario and sold the straddle before earnings, the position would theoretically be a winner if the stock moved less than 20% on the day of earnings.
Alternatively, under the 5% scenario, if a trader looked back at the previous earnings announcements and saw that stock XYZ had tended to move, on average, about 5% on earnings day, they may elect to do nothing because they believe the current straddle is “fairly” valued.
Earnings-focused options traders often filter the market for opportunities in which they think the expected move of the straddle is priced too high, or too low, for a given earnings event.
The first step in this process is to confirm the exact date of an earnings release, and then to identify which expiration month, or week, matches up with the earnings date.
Expiration months that capture earnings will generally show higher levels of implied volatility than the expiration months that don’t capture earnings—all else being equal. Of course, implied volatility may also be elevated in other expiration months if highly impacting news is expected to be released in that month (for example, an FDA decision for a biotechnology company).
Investors and traders can analyze this information by looking at the option chain, or options matrix. The option chain essentially segments the options market for a given underlying by expiration date.
It should be noted that because some earnings events can be highly volatile, some market participants choose not to trade during these periods. Alternatively, a trader might decide to open an earnings-focused position, but elect to hedge that position more conservatively to help reduce event risk.
The hedging of earnings-focused positions was recently covered on a new episode of From Theory to Practice on the tastytrade financial network. On this episode, the host of this show—Dr. Jim Schultz—walks viewers through the philosophy behind hedging, as well as some helpful earnings-related examples.
To learn more about hedging earnings-focused trades, readers are encouraged to watch the complete episode of From Theory to Practice when timing allows. Additional information on the earnings trade can also be found on this recent episode of Best Practices.
Look for the next issue of the award-winning Luckbox, Thinking in Bets, in your inbox or mailbox around Aug. 3.
Sage Anderson is a pseudonym. He’s an experienced trader of equity derivatives and has managed volatility-based portfolios as a former prop trading firm employee. He’s not an employee of Luckbox, tastytrade or any affiliated companies. Readers can direct questions about this blog or other trading-related subjects, to support@luckboxmagazine.com.