Washout in the S&P 500’s P/E Ratio Could Signal a Market Bottom
Over the last several months, the S&P 500 has corrected by about 10%, and the current selloff could intensify if expectations for ongoing corporate earnings don’t rebound soon

- Over the last several months, the S&P 500 has corrected by about 10%.
- The biggest headwind in the stock market appears to be corporate earnings, which have registered negative growth in four consecutive quarters.
- If the selloff intensifies, investors and traders can watch for a washout in the S&P 500’s Price/Earnings ratio, which may be indicative of a market bottom.
After peaking in mid-summer above 4,600, the S&P 500 recently retraced down to nearly 4,100—representing a decline of roughly 10.5%.
That’s certainly no small pullback, but looking through the lens of history, 10% corrections in the major market indices aren’t that uncommon. From 2002 through 2021, the S&P 500 corrected by at least 10% in ten of those twenty trading years.
Moreover, according to research conducted by Charlie Bilello, the frequency of 10% corrections only increases as you expand the sample size. From 1928 through the present, “a 10% intra-year drawdown has happened every 1.6 years on average.”
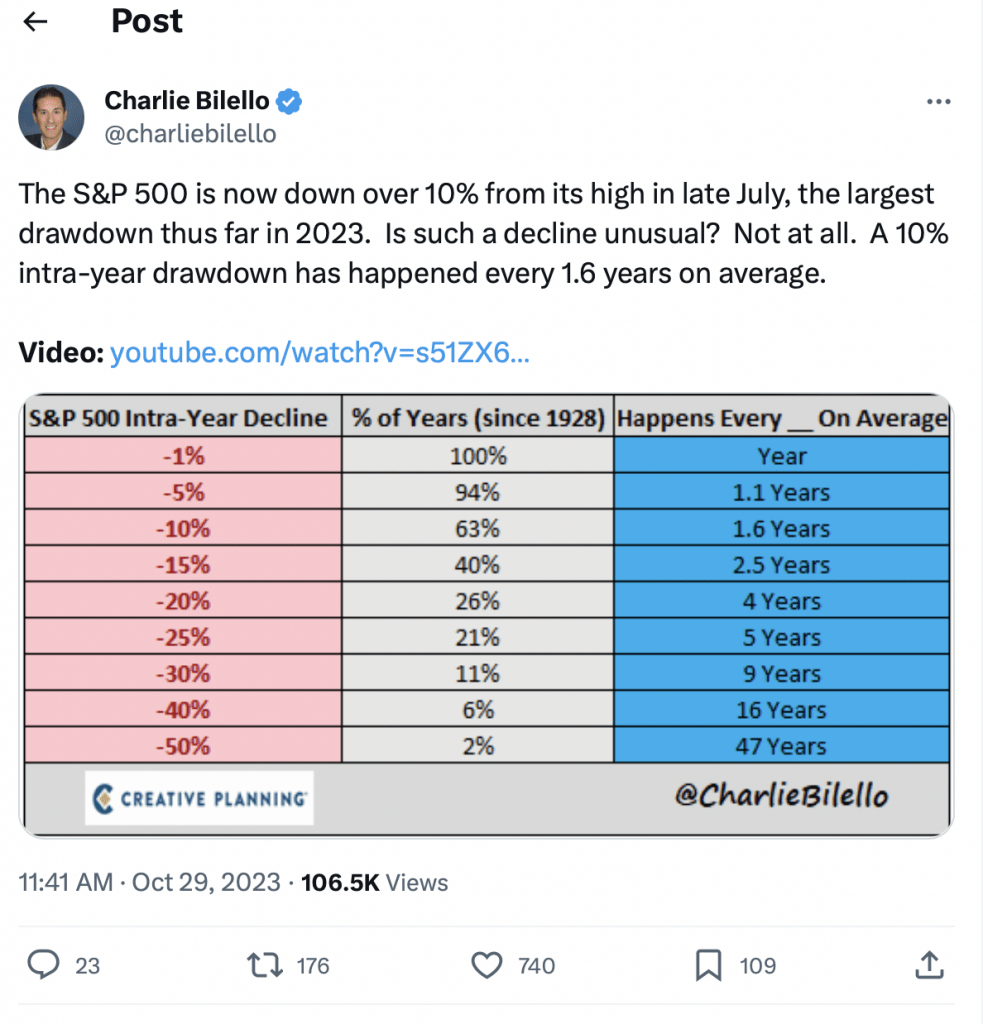
Considering that context, it’s no great surprise that 2022 and 2023 also featured corrections of at least 10%. Last year, the S&P 500 dropped from peak to trough by about 25%, and over the last several months, the S&P 500 has fallen by more than 10%.
Despite those moves, the S&P 500 remains only 12% below its all-time record high of roughly 4,800. Moreover, the S&P 500 is still up 11% year-to-date in 2023.
The aforementioned data may help explain why the CBOE Volatility Index (VIX) is currently trading at 17—a couple points below its long-term average. Clearly, the recent 10.5% correction hasn’t struck fear in the markets, and based on the aforementioned data, maybe it shouldn’t.
A Brief History of 20%+ Corrections
The big question now is whether the current 10% correction represents a good buying opportunity, or whether this particular 10% correction will deteriorate into a 20%+ correction.
The latter are considered “major” pullbacks, and are obviously more rare than 10% corrections.
In the 21st century, there have been six instances in which the S&P 500 declined by 20% or more. as highlighted below (peak to trough percent decline in S&P 500). However, it should be noted that 2001-2002 and 2008-2009 were part of the same broader market corrections.
- 2001: -30%
- 2002: -33%
- 2008: -49%
- 2009: -28%
- 2020: -34%
- 2022: -25%
Notably, four of the six 20%+ corrections listed above were clustered around tumultuous periods in the U.S. economy. Those would be the Great Recession and the COVID-19 pandemic—both of which served as major shocks to domestic and international economic activity.
In the case of the COVID-19 pandemic, the sharp decline in U.S. gross domestic product (GDP) was only temporary, while the Great Recession saw an extended decline. That probably helps explain why the stock market corrected so sharply from 2007 to 2009, and took so long to rebound.
In comparison, the U.S. economy snapped back in sharp fashion after the initial shock of the pandemic, as did the stock market.
These examples suggest that if the U.S. economy enters a severe recession in late 2023 or early 2024, stock prices could correct further from here—potentially pushing the current 10% closer to a 20% correction, or worse.
It seems unlikely however, that the current market correction devolves into anything akin to the Great Recession, when the S&P 500 dropped by more than 50% from peak to trough.
Tracking Valuations in the Market Using the Price/Earnings Ratio
Stock prices can weaken for a variety of reasons, but one of the key areas of weakness in recent times has been corporate earnings. Profitability is a key drive of valuations in the stock market.
And according to data compiled by FactSet, the S&P 500 has now registered four consecutive quarters of negative earnings growth. Considering that earnings backdrop, it’s no great surprise that stock valuations have also moved lower.
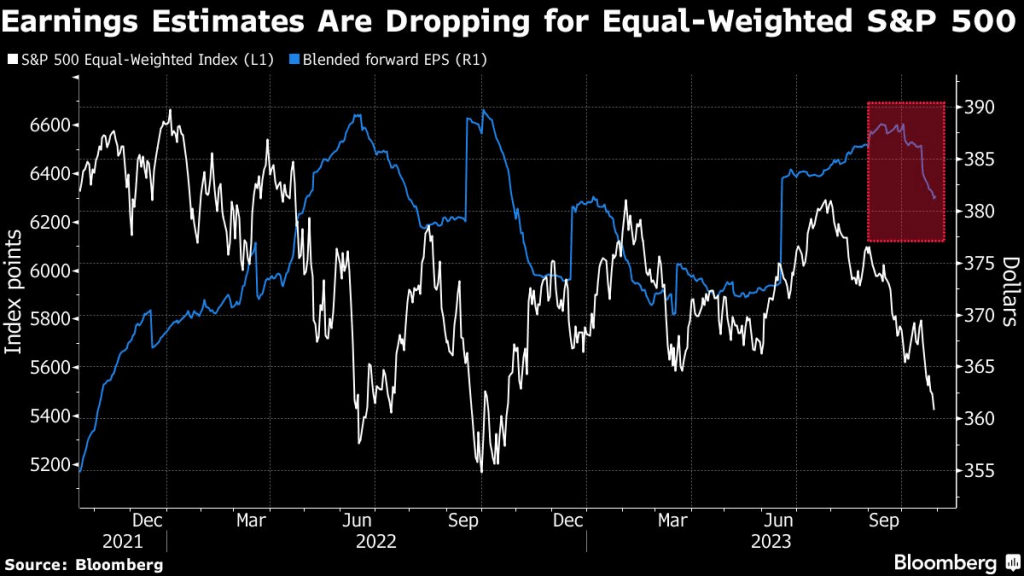
Going forward, investors and traders may want to keep a close eye on valuations in the market, because historically, a washout in the Price/Earnings ratio of the S&P 500 has signaled a market bottom.
At a high level, the Price/Earnings (a.k.a. P/E ratio) is used to help ascertain relative valuations within (and across) industries in the stock market.
Mathematically, the P/E calculation is relatively straightforward. To determine the P/E ratio, one simply takes the price per share of the stock and divides it by the earnings per share (EPS) of the stock. Investors and traders often use the result of that calculation to assess the value of a specific company, and compare that value to other companies in the same industry.
However, the P/E ratio is also commonly used to assess the relative value of the stock market as a whole.
To do so, one divides the average stock price of the large-cap stocks in the S&P 500 (e.g. “price”) by the respective mean earnings of those companies (e.g. “earnings”). The result of that calculation equates to what many refer to as the P/E of the “market.”
This figure is important because it can be tracked over time. And from the early 1900s through today, the mean P/E for the S&P 500 is about 16.
That means when the market’s P/E rises above 16—especially to an extreme degree—some market pundits start to worry about “overvaluations.” And when the market’s P/E drops below 16, there’s concern that the market has overshot to the downside—that valuations are too low.
Why a Washout in the S&P 500’s P/E Ratio Can Signal a Market Bottom
Currently, the P/E ratio for the S&P 500 is hovering at about 24, which is 50% higher than the long-term mean. However, an elevated P/E isn’t necessarily unusual, especially when corporate profits are trending lower.
That’s because lower corporate earnings translate to a smaller denominator in the P/E calculation, which in turn inflates the overall P/E ratio. The easiest way to rectify that situation is through lower stock prices (e.g. by lowering the numerator).
And when the stock market corrects, the P/E ratio of the S&P 500 often washes out, which can be a signal that the market has bottomed.
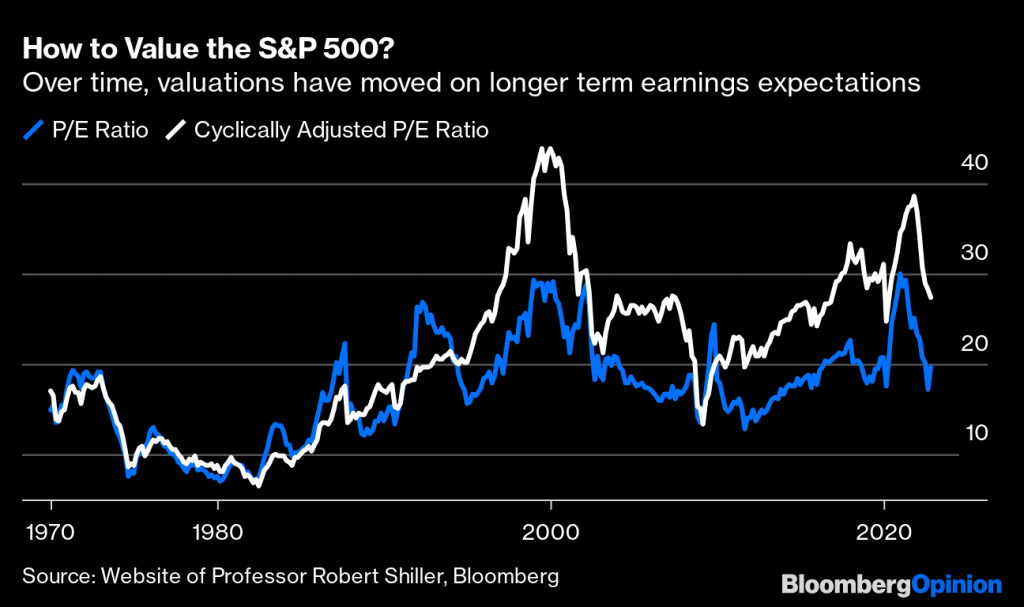
According to Doug Ramsey—the Chief Investment Officer at the Leuthold Group—the P/E ratio of the S&P 500 dropped to 13.5 during the 2001-2002 market correction, and down to 13 amidst the pandemic-related selloff in March of 2020. Earlier this year Ramsay suggested that stocks were overvalued when he told Morningstar, “Large-cap stocks are expensive. They are not even close to discounting even a mild recession.”
After the recent 10% selloff in the S&P 500, those sentiments appear quite prescient. And as highlighted below, the S&P 500’s P/E ratio hasn’t yet washed out (this year or last), which may indicate that further downside is yet to come.
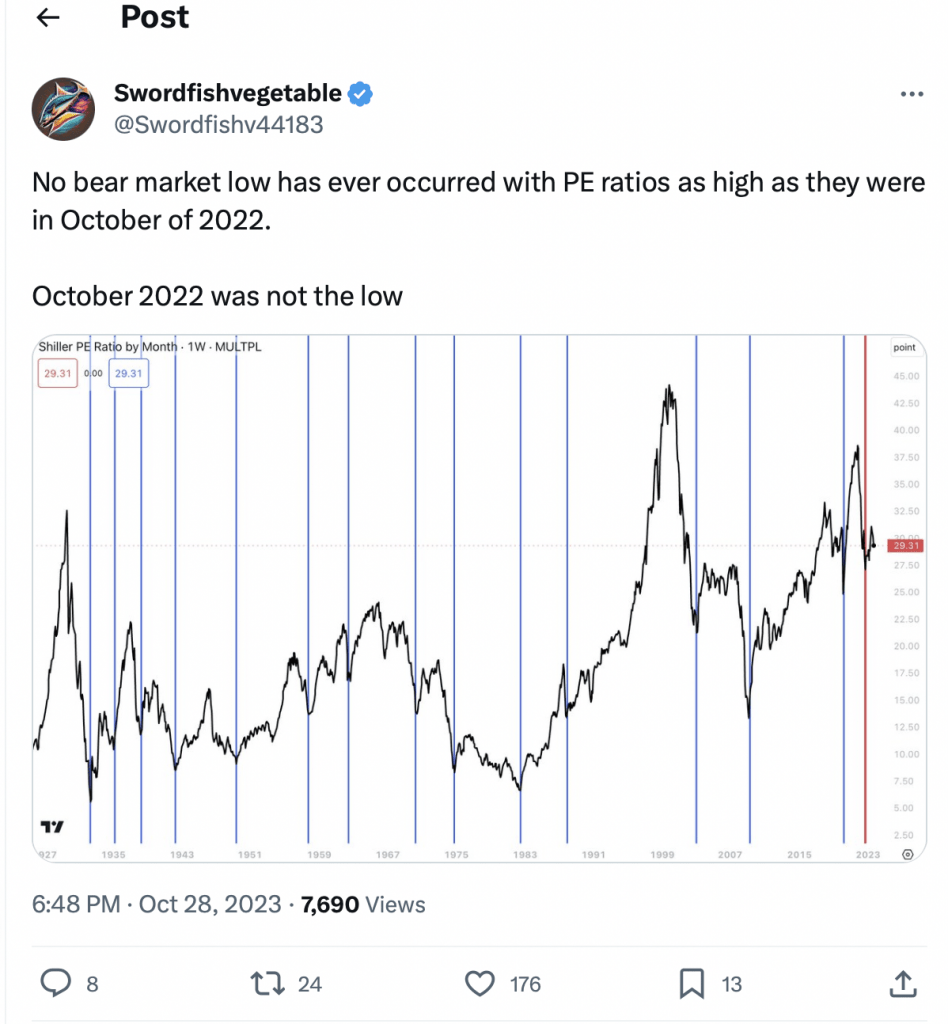
Going forward, corporate earnings will likely need to strengthen in order for the stock market to stage a turnaround. But if that earnings rebound fails to materialize, then stocks could be in for a “hard landing.” Under that scenario, the current 10% correction in the S&P 500 could quickly devolve into a 20% correction.
If that comes to pass, investors and traders can track the P/E ratio for a potential washout, which may be indicative of a market bottom. For example, if the P/E ratio dropped to between 13 and 14, as it did back in 2002 and 2020.
At that level, the P/E of the S&P 500 would be sitting below its historical mean of 16, which would represent another reason to be bullish on stocks.
To trade the major market indices, many market participants use index ETFs such as the SPDR S&P 500 ETF Trust (SPY). In addition to SPY, some other well-known index ETFs include the SPDR Dow Jones Industrial Average ETF Trust (DIA), the Invesco QQQ Trust Series 1 (QQQ) and the iShares Russell 2000 ETF (IWM).
To follow everything moving the markets, including the commodities markets, tune into tastylive—weekdays from 7 a.m. to 4 p.m. CDT.
Andrew Prochnow has more than 15 years of experience trading the global financial markets, including 10 years as a professional options trader. Andrew is a frequent contributor Luckbox Magazine.
For daily financial market news and commentary, visit the News & Insights page at tastylive or the YouTube channels tastylive (for options traders), and tastyliveTrending for stocks, futures, forex & macro.
Trade with a better broker, open a tastytrade account today. tastylive, Inc. and tastytrade, Inc. are separate but affiliated companies.
Hungry for more? The next issue of Luckbox is food-focused looking at new growth opportunities and trading ideas in food, beverage, agricultural, hospitality and grocery stocks. Not a subscriber? Subscribe for free at getluckbox.com.


