Straddles Minimize Exposure to Outlier Moves
One of the biggest threats when trading short volatility is the risk of a big, unexpected move (i.e. outlier move) in the underlying price.
Options are priced according to historical volatility, as well as the market’s expectation for future volatility. That means unanticipated events can sometimes derail the expected performance of a short premium position.
Situations like the above are why many options traders often take precautions to protect their portfolios against outlier moves.
Two of the more popular approaches, as outlined on a recent episode of Trade Logic Unlocked on the tastytrade financial network, involve prudent decision-making when it comes to both the selection of the underlying, as well as the selection of the specific trading approach/strategy.
Let’s first consider the former: Selecting an appropriate underlying.
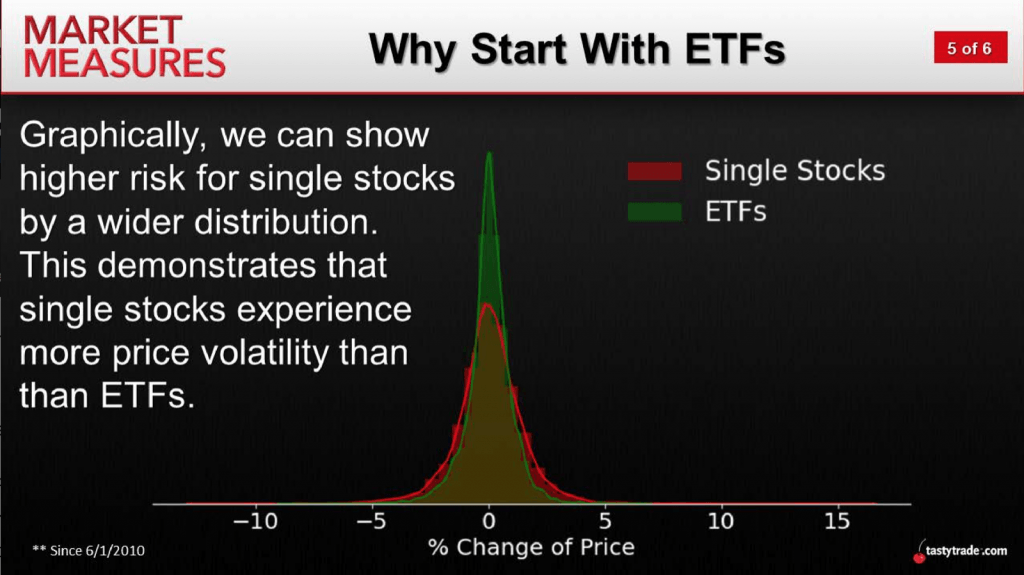
One tactic many options traders often adopt to help mitigate risk is to trade the options of ETFs, as opposed to single stocks, when building their portfolios. These products are generally better diversified, and less susceptible to outlier moves, because concentrated exposure to a single company is far reduced in an ETF.
The chart below helps illustrate how the risk inherent in ETFs is reduced as compared to single stocks:
Beyond focusing on well-diversified underlyings, like ETFs, another step traders can take when seeking to protect their portfolios from outlier moves involves strategy selection.
In this case, the decision rests not with the strategy itself per se, but rather the risk profile of the ultimate position — specifically, whether the position represents a “defined risk” exposure, or an “undefined risk” exposure.
An easy example that helps illustrate the difference between the two is a long straddle versus a short straddle. A straddle is an option position with two separate legs involving the at-the-money call and put (of the same strike) in the same expiration period. Buying both the call and the put results in a “long straddle,” while selling the call and the put results in a “short straddle.”
With a long straddle, the trader knows before deployment that his/her maximum loss is the total amount of premium outlaid for the straddle. In this sense, the risk of the worst case scenario is clearly defined.
On the other hand, a short straddle represents the opposite exposure. In the case of a short straddle, the seller of this position theoretically is on the hook for “unlimited losses.” While “unlimited” may be extremely improbable, extensive losses are certainly a risk. The point is that the potential for losses is theoretically uncapped. It’s therefore easy to see how this represents an “undefined risk” in the portfolio.
Based on the above examples, it’s easy to see how a defined risk position infers that a trader knows the potential maximum gain and the potential maximum loss (and the space between) before a given trade is deployed. On the other hand, undefined risk strategies theoretically expose a trader to “unlimited losses,” under certain conditions and scenarios.
Another example helps reinforce the difference between both types of positions.
A vertical spread involves buying and selling options with the same expiration date, but different strike prices. When executed 1-to-1 (meaning the same number of long and short contracts on each leg of the trade), vertical spreads offer defined risk whether you are the buyer or the seller.
This example helps illustrate that it’s not always the type of spread or the side taken that dictates the nature of risk.
Throwing some actual numbers into the vertical spread example provides additional illumination on the risk dynamic of this trade.
For example, consider that stock XYZ is trading for $142/share. After checking the options market, the trader finds that the $135 strike call is trading for $9, while the $150 strike call is trading for $2 — both in the front-month expiration.
To initiate a long vertical spread, the trader would purchase the $135 strike call, while simultaneously selling the $150 strike call — in equal proportion. In terms of net premium, that means the trader has paid a total of $7 for the spread ($9-$2 = $7).
To calculate the maximum potential profit of this position, one simply subtracts the premium paid from the width of the strikes. In this case, the width of the strikes is $15 ($150-$135 = $15) and the net premium paid is $7, so that equates to $15-$7 = $8. In order to calculate the maximum profit, one therefore simply multiplies $8 times the option multiplier (100) times the number of contracts traded (in this case 1).
That means the maximum profit is $8 x 100 x 1 = $800. On the other hand, the maximum loss is simply the net premium paid $7 x 100 x 1 = $700. Depending on where the underlying settles at expiration, the profit/loss for this position could be anywhere between a loss of $700 and a gain of $800.
For a vertical spread, the profit and loss profile is also “defined” for the seller. In this case, the seller of this same vertical spread could lose at most $800, and make at most $700.
When trying to limit exposure to outlier moves in the portfolio, it’s therefore critical to understand the difference between “defined risk” and “undefined risk” position structures prior to trade deployment. By focusing on well-diversified underlyings such as ETFs, as well as “defined-risk” trades, exposure to outlier moves is minimized.
For more information on this approach to risk management, traders can review the complete episode of Trade Logic Unlocked when scheduling allows.Sage Anderson is a pseudonym. The contributor has an extensive background in trading equity derivatives and managing volatility-based portfolios as a former prop trading firm employee. The contributor is not an employee of luckbox, tastytrade or any affiliated companies. Readers can direct questions about any of the topics covered in this blog post, or any other trading-related subject, to support@luckboxmagazine.com.


