Trading Monster Rallies
The iShares Russell 2000 Index ETF (IWM) rallied an astounding 18% in November and opened up some new trading opportunities in the process.

In the financial markets, price and fear tend to be inversely correlated. When the CBOE Volatility Index (VIX) is screaming higher, that usually corresponds with a sharp pullback in broad market indexes, such as the S&P 500 and the Nasdaq.
That precise scenario unfolded earlier this year, as the devastating potential of the coronavirus pandemic crystalized.
However, that inverse relationship isn’t perfect. Historically, there have been instances when the price-fear relationship breaks down. In such scenarios, price and fear can move in the same direction (i.e. exhibit a temporary positive correlation).
Case in point, the Russell 2000 this past November. During the 22 trading days of November, the iShares Russell 2000 Index ETF (IWM) skyrocketed an astounding 18%. And interestingly, implied volatility in the IWM remained stubbornly high, despite the strong upward momentum in the underlying.
It’s one of those rare instances when market fears failed to dissipate as the underlying price of the index strengthened. The chart below highlights how the VIX of IWM, known as the CBOE Russell 2000 Volatility Index (RVX), remained stubbornly high despite the recent rally—trading well above its historical average.
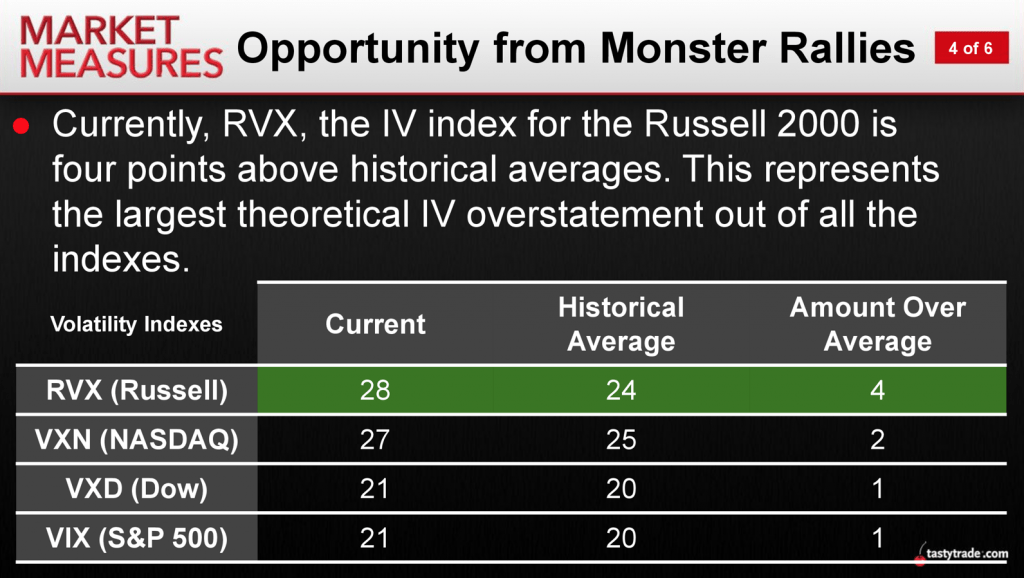
Whether one views the above situation as an attractive opportunity to sell volatility is of course dependent on one’s strategic approach, market outlook and risk profile.
For example, if one believed that the overall risk environment was growing increasingly uncertain, despite the broad-based rally in IWM, then the current levels of volatility might not be viewed as “rich” enough to warrant new short positions.
For further insight on the current situation in IWM-RVX, it’s instructive to review previous research conducted by tastytrade.
The slide below illustrates that price and fear have historically moved in the opposite direction roughly 83% of the time. That means 17% of the time price and fear move in the same direction.
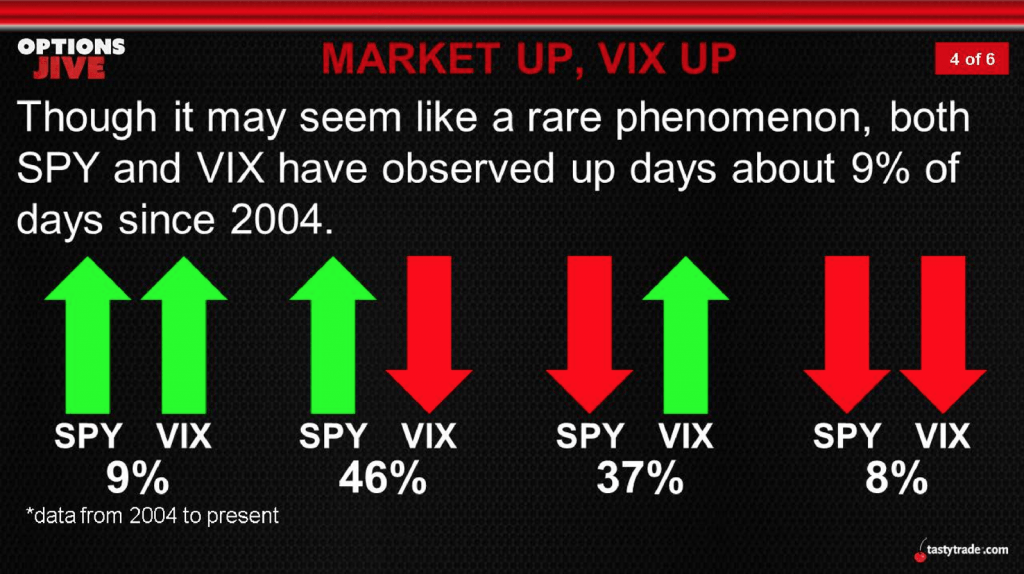
The above illustrates that in SPY-VIX, price and fear both move higher about 9% of the time. Additionally, they’ve both moved lower simultaneously roughly 8% of the time.
The question is whether this behavior ultimately has any predictive power. For example, is a trading environment in which price and fear move in the same direction indicative of a potential correction?
According to historical data, the answer appears to be “no.”
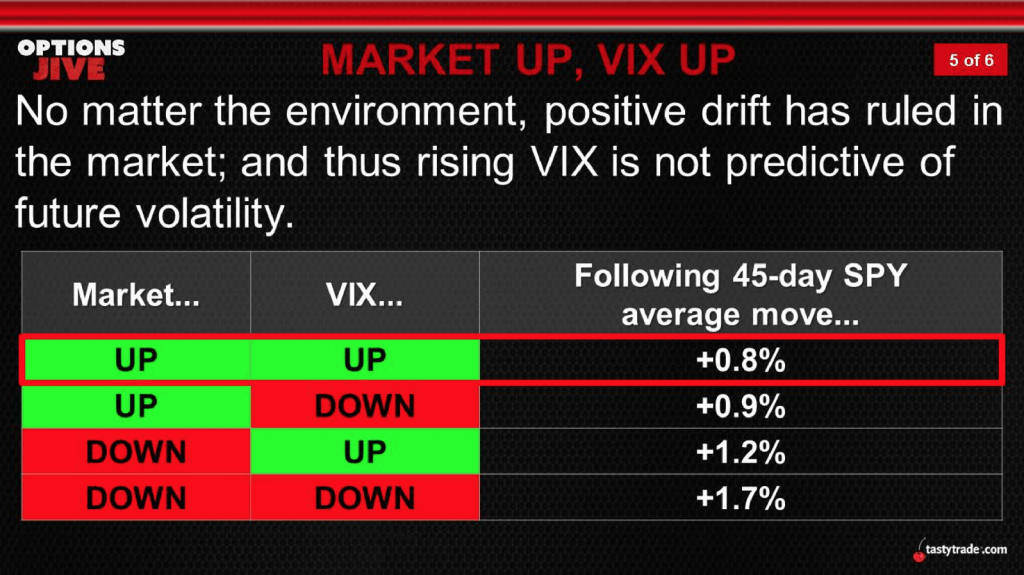
A review of all trading data in SPY and VIX (going back to 2004) revealed that the market tends to move higher over the ensuing 45-day window no matter the relationship between price and fear. The only difference appears to be a small change in the degree to which the underlying rallies, as outlined below.
During an especially strong rally—like the one observed in IWM during November—investors and traders often get concerned that the move might be “overdone.” That’s often why implied volatility (i.e. fear) temporarily moves in the same direction as price, as fears grow that a correction might be right around the corner.
However, historical data doesn’t bear out these concerns—at least for broad market indexes like SPY.
As shown in the previous slide, indexes like SPY have historically rallied even when price and fear are observed to be moving in the same direction. Taken together, this research should provide additional insight on the current situation in IWM-RVX.
To learn more about the short premium trading philosophy (i.e. short volatility), readers are encouraged to review a recent episode of Best Practices on the tastytrade network when scheduling allows. More information on monster rallies is also available through this link.
To follow everything moving the markets on a daily basis, TASTYTRADE LIVE is also recommended.
This December, give the gift of Luckbox and get a free Luckbox T-shirt! See SUBSCRIBE or UPGRADE TO PRINT (upper right) for more information.
Sage Anderson is a pseudonym. The contributor has an extensive background in trading equity derivatives and managing volatility-based portfolios as a former prop trading firm employee. The contributor is not an employee of Luckbox, tastytrade or any affiliated companies. Readers can direct questions about any of the topics covered in this blog post, or any other trading-related subject, to support@luckboxmagazine.com.