Trading Options Using Volatility Metrics
When trading options, investors and traders have a plethora of data at their disposal to assist with trade analysis, including Implied Volatility Rank and Implied Volatility Percentile.

One benefit of trading options as compared to stocks and futures is that investors and traders have access to additional metrics that can be used to identify and analyze potential trades.
For example, stock and futures traders generally have to analyze the current price of a given underlying and ascertain whether it’s cheap, expensive or fair.
In the options arena, market participants can look beyond the dollar and cents and consider a vast pool of volatility data. Implied volatility and historical volatility are a couple of the more popular metrics:
- Implied Volatility: Implied volatility is derived from the dollar and cents prices of options trading on exchanges, and reflects the market’s expectation for movement in the associated underlying over the duration of the contract. This value therefore represents the ongoing market price for volatility in a given option contract.
- Historical Volatility: Every stock has a specific opening and closing price for each trading day of its existence. That data can therefore be used to compute what’s known as historical volatility (aka “actual volatility”), which reports exactly how much a security has moved over a defined period of time.
In short, implied volatility basically reflects the market’s expectation for movement, while historical volatility, or actual volatility, reports what has actually occurred.
Looking at an example, consider hypothetical stock XYZ has a one month historical volatility of 22.
If options in XYZ are trading with an implied volatility of 30, an opportunity theoretically exists to sell that option with the expectation that actual volatility in the underlying over the upcoming one month period will be less than 30 (and potentially closer to the recent historical volatility of 22).
This hypothetical position of course isn’t guaranteed to turn a profit, because future volatility at the end of the day is unknown.
But as demonstrated by a wide range of market studies, implied volatility has consistently exhibited mean-reverting behavior. That means a portfolio composed of many high-probability mean-reversion trades should theoretically produce a profit—on average, over time.
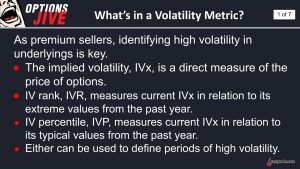
Beyond implied volatility and historical volatility, options market participants can also use additional volatility metrics to analyze potential opportunities—specifically Implied Volatility Rank (aka IV Rank) and Implied Percentile Rank (aka IV Percentile).
Implied Volatility Rank
The tastytrade financial network developed a metric known as “Implied Volatility Rank,” or IVR, to help identify when implied volatility (i.e. the price of an option in volatility terms) has reached an extreme. IV Rank reports whether implied volatility is high, low or neutral in a specific underlying—based on the past year of data.
For example, if hypothetical stock XYZ has had an implied volatility between 30 and 60 over the past year and implied volatility in XYZ is currently trading at 45, then XYZ would theoretically have an IVR of 50%.
When IVR is high (>50%), one can usually expect a contraction lower to the mean. When IVR is low (<50%), one can usually expect an expansion higher to the mean.
Monitoring implied volatility in conjunction with IVR is therefore crucial for options traders because these figures provide important context on the relative price of a given option.
While other trading considerations need to be taken into account, an IVR above 50% might therefore be indicative of attractive options selling opportunities, while an IVR below 50% might be indicative of attractive buying opportunities—due to the mean-reverting nature of implied volatility.
Implied Volatility Percentile
Implied Volatility Percentile, or IV Percentile, is another metric that can be used, in addition to IV Rank, to help analyze potential trading opportunities.
IV Percentile represents the percentage of days that implied volatility has traded below the current level over the past year.
For example, if IV Percentile is 10% in underlying XYZ, that would mean that implied volatility has only traded below current levels 10% of the time over the course of the previous 12 months. That means 90% of the time, implied volatility in XYZ is above the current level.
Low IV Percentiles therefore infer that the opportunity to purchase volatility is likely stronger than the opportunity to sell volatility.
On the other hand, high IV Percentiles (>60%) infer that implied volatility is high as compared to recent history, and therefore may represent a good opportunity to sell volatility. For example, if IV Percentile was 95%, that would imply that implied volatility had traded below current levels 95% of days during the past 52 weeks.
The slide below illustrates an example in which IV Percentile is 21%.
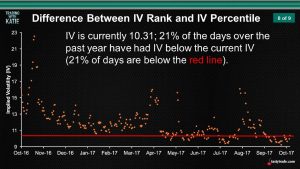
Looking at the above example more closely, one can extrapolate from the above that volatility in this underlying is currently on the low end—because 79% of the time, implied volatility is higher than it is now. That means a volatility trader probably wouldn’t be considering a short options position in this underlying at this time, and instead might be considering a long volatility (i.e. long options) position.
Readers seeking to learn more about the nuances of IV Rank and IV Percentile may want to review a new episode of Options Jive on the tastytrade financial network when scheduling allows. Another previous episode of Futures Measures is also helpful in illustrating the difference between the two metrics.
To follow everything moving the markets, readers can also tune into TASTYTRADE LIVE, weekdays from 7 a.m. to 4 p.m. CST, when scheduling allows.
Subscribe to Luckbox in print!
See SUBSCRIBE or UPGRADE TO PRINT (upper right) for more info.
Sage Anderson is a pseudonym. He’s an experienced trader of equity derivatives and has managed volatility-based portfolios as a former prop trading firm employee. He’s not an employee of Luckbox, tastytrade or any affiliated companies. Readers can direct questions about this blog or other trading-related subjects, to support@luckboxmagazine.com.