Trading the ‘Expected Move’ During Earnings Season
“Expected Move” refers to the market’s expectation for future movement in a given underlying, and this metric can be a helpful tool to lean on during earnings season.

With Q2 earnings in full swing, it’s worth revisiting one of the most important concepts when it comes to trading an earnings event—expected move.
Implied volatility tends to increase leading up to a given company’s earnings announcement. And due to that increase in implied volatility, market participants often look for opportunities to sell options/volatility that they view as too expensive, or too “rich.”
One approach for identifying attractive earnings trades is to use Implied Volatility Rank, which reports on how current levels of implied volatility compare to the last 52-weeks of data. Implied Volatility Rank (aka IV Rank or IVR) is certainly a helpful tool to use when filtering for potential ideas.
However, once a specific trade idea is selected, it can also be prudent to go through an additional exercise, to further analyze the relative attractiveness of a potential earnings position. And conveniently, this exercise is relatively straightforward.
In order to conduct this second-level analysis, an investor/trader merely needs to calculate (or estimate) the “expected move” for the earnings event.
Expected move is the amount that a stock is predicted to increase or decrease from its current price, based on the current level of implied volatility. Calculating the expected move involves just a few inputs—stock price, implied volatility and days until expiration.
But market participants can also use a quick “back-of-the-envelope” approach to estimate expected move, as well. Additionally, some brokerage firms (such as tastyworks) calculate and publish expected move on their software platforms.
Calculating and Estimating Expected Move
Fortunately, the math behind the expected move calculation isn’t that complicated. The inputs needed when calculating this metric are:
- Stock price (SP)
- Implied volatility (IV)
- Days to expiration (DTE)
Once a trader has identified the above numbers, they can be plugged into the following equation: (Stock Price) x (IV/100) x [square root (DTE/365)] = Expected Move.
Before jumping into a potential interpretation of the expected move metric, let’s first run through a simple example. For instance, imagine that 3M Co (MMM) is trading $133, and implied volatility is 32, while the days to expiration for the weekly straddle that includes earnings is 8.
Plugging those values into the expected move calculation, one gets: ($133) x (32/100) x [square root (8/365)] = +/-$6.16.
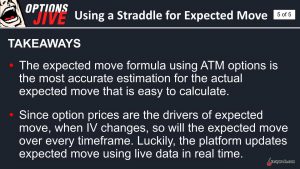
Now, let’s try the back-of-the-envelope approach, which provides a similar outcome, with a less involved calculation. To estimate the expected move using current option prices, one simply adds together the value of the at-the-money (ATM) call and put from the near-term expiration, and multiplies that value by 85%.
At this time, it’s estimated that MMM will announce earnings on July 26, 2022. Looking at the current market for options prices in MMM, one can see that the ATM call and put for the weekly expiration that includes earnings are $5.15 and $2.10, respectively.
Adding those figures together, one arrives at a value of $7.25. Now, to estimate the expected move, one simply multiples that value by 85%, which equals roughly $6.16 ($7.25 x 0.85 = $7.25)—a figure that’s exactly on par with the formal expected move calculation.
Alternatively, one can add together the ATM straddle, and the nearest out-of-the-money (OTM) strangle, and then divide that sum by 2. This calculation will yield a similar figure.
Interpreting Expected Move
Once the expected move is calculated, market participants can use that figure to analyze how the current earnings move lines up with past moves.
For example, in the case of MMM, the expected move of $6.16 implies that between now and July 29 (the expiration date of the weekly option which includes earnings), MMM is expected to move by 4.6% ($6.16/$133 = 4.6%).
Considering that earnings are expected to be released next week (on July 26), the bulk of that move is almost certainly being attributed to the earnings event.
Now, one can look back at the history of MMM, and ascertain how the stock usually moves on earnings. One could take an average of those moves, to see the average amount the stock moves on earnings. Or, one could look specifically at how MMM has moved during the summer earnings cycle in particular, over the last several years.
In the wake of its most recent earnings report (April 26), shares in MMM moved about 2% (from the close of trading on April 25 to the close of trading on April 26). Prior to that, the last three earnings moves were 2.5%, 2.2% and 1%, respectively. The average of those four moves is just under 2%.
Taken together, this data indicates that the market is currently expecting a fairly large move when MMM reports next week (July 26)—at least as compared to recent earnings releases for the company.
This may be due to the fact that 2022 has been an especially volatile trading year, and as a result, implied volatility is up across the board. On the other hand, the market may just be expecting that 3M is due for a large move on earnings. Each individual investor or trader must decide on their own whether this expected move is appropriate.
In general, when options market participants view an earnings straddle as “rich,” they often consider selling options/volatility heading into an earnings day (like a short straddle or strangle). In this case, if the expected move is priced at 4.6% in the market, and the stock only moves 2% (or less) on the earnings day, then the short straddle/strangle should theoretically produce a profit.
Alternatively, when market participants view the expected move for an earnings event as cheap, they sometimes consider buying options/volatility. For buyers of earnings straddles/strangles, the goal is for the stock to make a bigger move than expected. For example, if the expected move was 2%, and the stock actually moved by 5%.
Through the aforementioned examples, one can see how the expected move calculation—and the associated back-of-the-envelope estimate—provide market participants with another important data point that can be used to evaluate potential earnings trades.
To learn more about the expected move metric, and where to find it on the tastyworks platform, check out this installment of Options Trading Concepts Live on the tastytrade financial network. To learn more about trading earnings season, watch this episode of Best Practices.
Note: The examples used in this post are for educational purposes only, and should not be interpreted as a recommendation for any particular course of action.
Sage Anderson is a pseudonym. He’s an experienced trader of equity derivatives and has managed volatility-based portfolios as a former prop trading firm employee. He’s not an employee of Luckbox, tastytrade or any affiliated companies. Readers can direct questions about this blog or other trading-related subjects, to support@luckboxmagazine.com.