Market Volatility Expected to Rebound in 2024 After December Lull
December tends to be one of the least volatile months on the calendar, but with a major election looming in 2024, market volatility is expected to rebound in the new year
- Market volatility tends to bottom out during the month of December.
- According to historical data, January and February are among the most volatile months on the calendar, second only to September and October.
- The 2024 trading year has the potential to be more volatile than average due to the November elections.
As we predicted in late summer, volatility in the markets did increase in fall.
Starting in mid-September, the CBOE Volatility Index (VIX) rose from a low of about 12 all the way up to 23 by mid-October. And that move was primarily attributable to the 10% correction in the S&P 500, which occurred between Aug. 30 and Oct. 27.
The S&P 500 and the VIX traditionally share a strong inverse correlation, so that was a textbook move in the VIX, considering the aforementioned pullback in the S&P 500.
Somewhat unexpectedly, however, the S&P 500 rebounded from the October lows, and has proceeded to recapture all of its autumn losses. Since Oct. 27, the S&P 500 is up 11% and now trades back above 4,500.
The VIX has once again responded in kind, and has drifted back toward the low teens—moving in the opposite direction as the S&P 500. Today, the VIX trades about 13.
Interestingly, the current levels in the S&P 500 and the VIX—4,500 and 13—are virtually identical to those observed before the autumn selloff. With the calendar now shifting to December, historical data suggests that market volatility will remain muted through the end of the year.
That’s largely because the market often rallies between Thanksgiving and New Year’s Day—a phenomenon referred to as the Santa Claus rally. But for those that prefer a little more action (e.g. volatility) in the markets, all is not lost.
History says that volatility will rebound again in January and February, as illustrated below.
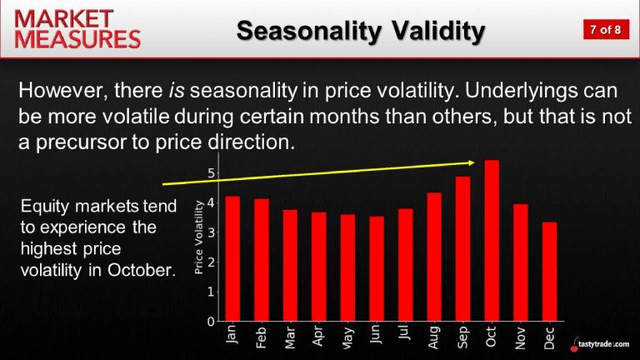
January and February tend to be a couple of the more volatile months on the calendar, if not quite so volatile as September and October.
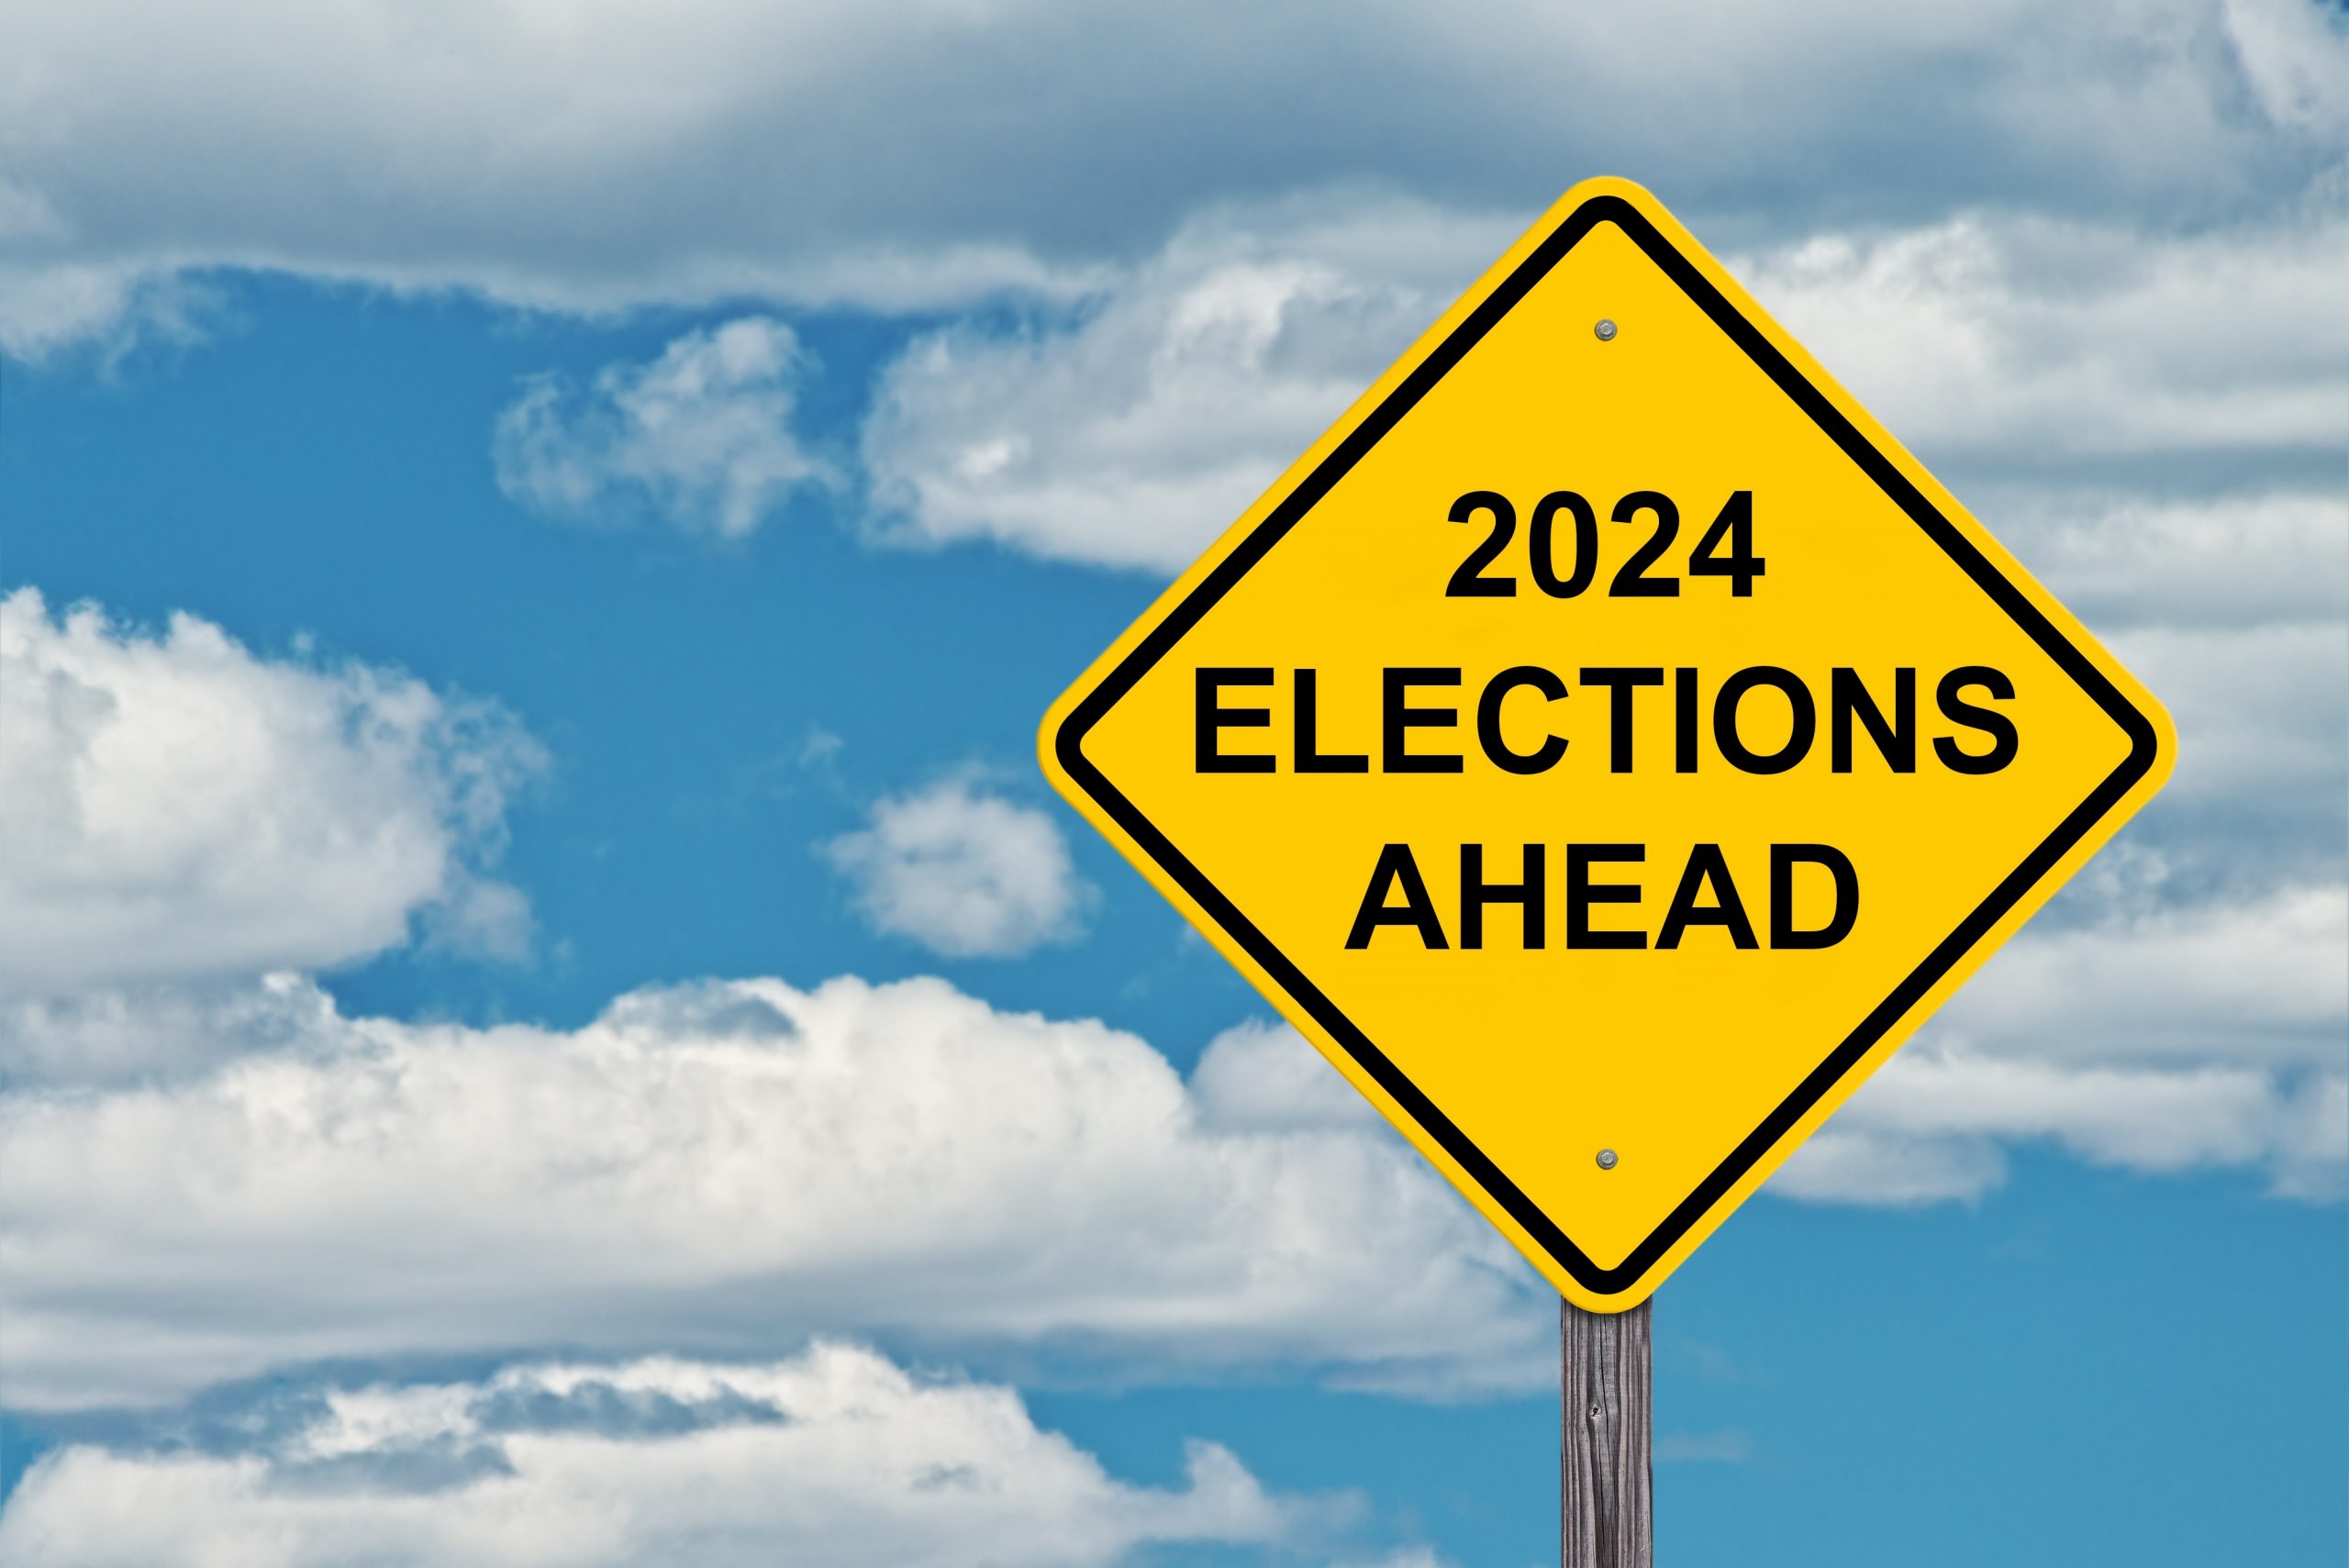
Election 2024
Next year is especially intriguing because 2024 features a U.S. presidential election. Historically, trading years that encompass major elections have been more volatile than other years, on average. That’s largely because uncertainty tends to breed volatility in the markets.
Certainly, there’s no guarantee that 2024 will be a crazy trading year, but according to research conducted by Hamilton Place Strategies, it’s virtually assured that implied volatility will steadily rise next year.
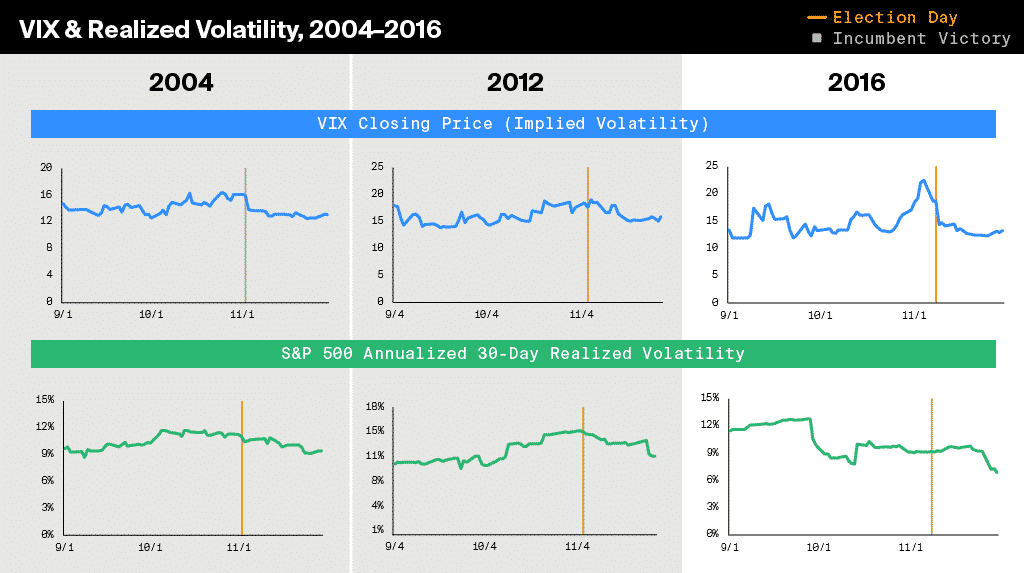
Implied volatility typically increases leading up to the November elections (blue-colored graphs), but realized volatility doesn’t always follow suit (green-colored graphs).
As a reminder, implied volatility represents the current market price for volatility, as observed in the options markets. Realized volatility, on the other hand, is the actual movement that occurs in a given underlying over a defined past period.
Interestingly, the aforementioned pattern is very similar to what’s observed during corporate earnings season. Leading up to an earnings event, implied volatility tends to inflate. However, realized volatility doesn’t always follow suit.
In the wake of the election, Hamilton’s research also shows that both implied and realized volatility tend to decline. That’s because the passing of the event (i.e. the election) removes a large degree of uncertainty from the equation. That same deflation in implied and realized volatility is often observed in the wake of earnings events, as well.
How the Outcome of the Elections Could Impact Future Stock Market Performance
Another key consideration in 2024 is the outcome of the elections. In particular, the makeup of the government in the aftermath of the elections.
Historical data shows that the stock market tends to perform better when Congress is “split”—meaning each party controls one chamber of Congress. As highlighted in the graphic below, the stock market has posted the best historical returns (on average) when Congress is split and a Democrat sits in the Oval Office.
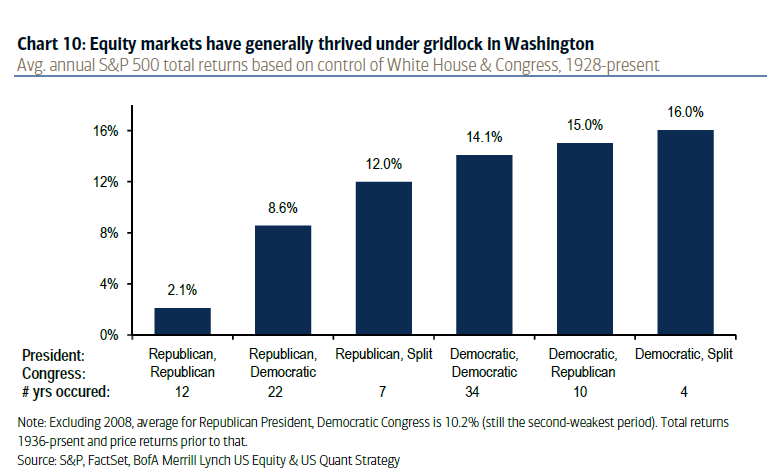
The best possible outcome for the financial markets is likely a split Congress, no matter which party controls the White House. During those periods, the market has returned 16% annually (on average) with a Democrat in the White House, and 12% annually with a Republican in the White House. That’s according to data from 1936 to 2018.
Last year RBC Capital Markets re-ran the data, and found that the updated figures are fairly similar. According to RBC, the stock market has returned 14% with a split Congress and a Democrat in the White House, and 10% with a split Congress and a Republican in the White House (data from 1932 to 2022).
In contrast, historical data indicates that stock market performance deteriorates when one party is in full control of the federal government.
When Democrats have been in full control of the federal government, the stock market has historically returned 14% annually (on average). On the other hand, when Republicans have been in full control of the federal government, that figure slips to just 2%.
Looking ahead, this data suggests that the best possible outcome for the 2024 election, in terms of expected performance in the stock market, would be a split Congress. Under that scenario, the financial markets would arguably be agnostic to the outcome of the presidential election.
Interestingly, some political pundits are already projecting that a split Congress is a likely result of the November 2024 elections. Axios recently indicated that it favors Democrats to take control of the House and Republicans to take control of the Senate in 2024.
However, it’s still very early in the election cycle, and it’s virtually assured that those projections will continue to shift in the coming months. To learn more about the political predictions market, check out the upcoming issue of Luckbox.
To follow everything moving the markets, including the options markets, readers can also tune into tastylive—weekdays from 7 a.m. to 4 p.m. CDT.
Andrew Prochnow has more than 15 years of experience trading the global financial markets, including 10 years as a professional options trader. Andrew is a frequent contributor Luckbox Magazine.
For daily financial market news and commentary, visit the News & Insights page at tastylive or the YouTube channels tastylive (for options traders), and tastyliveTrending for stocks, futures, forex & macro.
Trade with a better broker, open a tastytrade account today. tastylive, Inc. and tastytrade, Inc. are separate but affiliated companies.