Trading the Aftermath of the 2022 Midterms
Historical data shows the stock market outperforms when the opposing party of the president holds one or both chambers of Congress—a formula that’s especially potent when a Democrat sits in the Oval Office

Leading up to the 2022 midterm elections, most projections indicated that Republicans would win control of the House of Representatives, while control of the Senate was essentially a 50-50 toss-up.
In the aftermath of the midterms, those projections are proving prescient. As of Friday, Nov. 11, “gridlock” looks like the most likely outcome from the 2022 midterms, and for the financial markets, that might actually be the preferred scenario—especially for stock market bulls.
In the political realm, gridlock is a situation in which the government is unable to pass new legislation because the presidency and Congress are controlled by different political parties.
However, gridlock may not be the worst outcome for the financial markets.
Historical data shows that the stock market outperforms when the opposing party of the president holds one or both chambers of Congress.
These scenarios are highlighted in the graphic below, with the most attractive historical returns (on average) occurring with a Democrat in the White House and Republicans controlling one, or both, chambers of Congress.
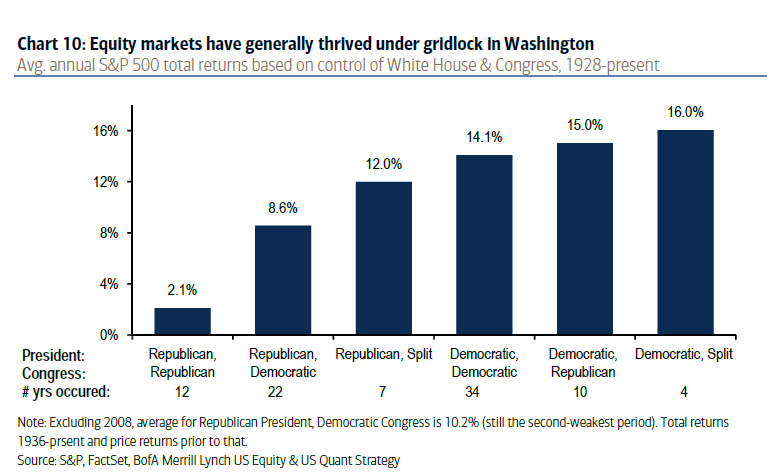
Going forward, it appears that the Republican party will hold a majority in the House of Representatives, while control of the Senate will hinge on a runoff election in Georgia. Per the above chart, those are the two preferred scenarios when it comes to historical stock market performance (look at the far right columns).
The data above also highlights how the best historical market returns with a Republican in the White House were also accompanied by gridlock. Of course, past results are no guarantee of future returns. However, this data certainly has to be encouraging for fatigued market bulls.
And history says the good news doesn’t end there.
Historical data also shows that a president’s third term tends to be the best when it comes to returns in the stock market. The chart below illustrates that going back to 1896, the third year of a given presidential term tends to be the highest performing of the four (on average).
This is somewhat logical, considering that the midterm elections occur during a president’s second year in office, while the subsequent presidential election occurs in the fourth year. Both of these election years undoubtedly contribute to increased uncertainty in the markets.

In addition to the above data, there’s one more important historical statistic that could send market bears into hibernation for the winter—and possibly beyond.
Since 1950, the average return for the S&P 500 during the 12 months after a midterm election is a jaw-dropping 15%. Surprisingly, there wasn’t a single instance of an overall negative return during any of those 12-month periods, either.
Considering all of the above, there’s a reason for optimism in the stock market going forward. However, one must also keep in mind that a large-scale war is still being fought in Eastern Europe.
That means unknown geopolitical developments could still dictate where the stock market trades from here—an important x-factor that all market participants must keep in mind during the coming weeks and months.
For daily updates on everything moving the markets—including the recent midterm elections—check out TASTYTRADE LIVE, weekdays from 7 a.m. to 4 p.m. CDT.
Sage Anderson is a pseudonym. He’s an experienced trader of equity derivatives and has managed volatility-based portfolios as a former prop trading firm employee. He’s not an employee of Luckbox, tastytrade or any affiliated companies. Readers can direct questions about this blog or other trading-related subjects, to support@luckboxmagazine.com.