What to Know About Earnings Season
Expectations for quarterly earnings season—which ramps up on Jan. 13—are tempered at this time due to the backdrop of rising interest rates and a slowing global economy

This year’s earnings season shifts into high gear on Jan. 13, when several of the country’s largest financial institutions are scheduled to release their financial results from the last quarter of 2022.
Citigroup (C), JPMorgan (JPM) and Wells Fargo (WFC) are all scheduled to announce their quarterly earnings before the market opens.
The upcoming earnings season is of particular interest because most market participants are eager to see if the current slowdown in the global economy is having a material impact on corporate profitability. Early indications suggest those concerns are valid.
On Jan. 6, the South Korean tech titan Samsung released its earnings report for the final three months of 2022, and the results weren’t pretty.
During Q4 2022, Samsung’s profits declined by 69% as compared to the year previous. Even worse, it was the company’s least profitable quarter in eight years. The company also reported a 10% drop in sales.
Results such as those help explain why the Nasdaq Composite was down more than 30% in 2022, as valuations in the market were playing catch up with declining earnings expectations.
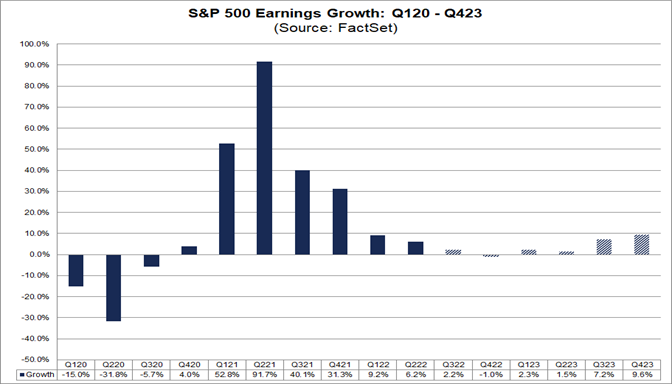
Mirroring Samsung’s troubling report, most projections suggest that the upcoming earnings season will show that corporate earnings growth has stagnated (on average), or even turned negative. At present, however, subpar earnings growth is only expected to last a couple of quarters, before rebounding somewhat in the second half of 2023.
These projections are highlighted in the FactSet data shown below.
Price/earnings ratio
One key metric that market participants can use to monitor the relative strength of corporate profitability, as well as associated valuations in the stock market, is the S&P 500 price-earnings (P/E) ratio.
The P/E ratio is calculated by taking the average stock price of large-cap stocks in the S&P 500 index and dividing that collective price by the mean earnings of those companies. The quotient of that calculation typically equates to what many refer to as the P/E of the market.
This figure is important because it can be tracked over time, and since the early 1900s, the average P/E for the market has hovered around 17.
When the market’s P/E rises above 17—especially to an extreme degree—some market pundits start to worry about overvaluations. The same can be said when the market’s P/E drops below 17, although in that case, the concern is that stocks might be getting undervalued.
For reference, the P/E ratio of the S&P 500 (CAPE ratio) rose above 40 a few months before the 2001-2002 tech bubble corrected. It also popped up to 40 again in 2021, when the furious post-pandemic rally pushed market valuations back into nosebleed territory.
Today, the P/E ratio for the S&P 500 stands at roughly 28. That’s still well above its long-term average of 17, but well below the record highs observed in 2001 and 2021, as illustrated below.

Based on the above, it’s difficult to forecast where the market’s P/E ratio goes from here. The current reading of 28 represents almost the exact mid-point between the metric’s recent high of 40 and its long-term average of 17.
One factor to consider, however, is that the average in the S&P 500 P/E ratio has been higher since the start of the 21st century. When shrinking the data set to fit just those years, the long-term average in the P/E rises above 20. And from that perspective, the current reading of 28 isn’t as outlandish.
If the P/E ratio is viewed as fair, that could translate to sideways action in the markets for the foreseeable future. Unless of course, some significant development comes to pass, which changes perceptions of the relative strength (or weakness) in the underlying U.S. economy.
To learn more about trading strategies geared toward corporate earnings season, check out this previous episode of Tasty Bites on the tastylive financial network.
To follow everything moving the markets this year—including the latest earnings updates—monitor tastylive, weekdays from 7 a.m. to 4 p.m. CDT.
Sage Anderson is a pseudonym. He’s an experienced trader of equity derivatives and has managed volatility-based portfolios as a former prop trading firm employee. He’s not an employee of Luckbox, tastylive or any affiliated companies. Readers can direct questions about this blog or other trading-related subjects, to support@luckboxmagazine.com.