Volatility: Trading’s Best Crystal Ball
Volatility provides a clue about what the future may hold for a stock
Long-term stock trader? Short-term options trader? Medium-term money machine? No matter how an investor plans to extract profits from the markets, it pays to know how high or low a stock, index or exchange-traded fund (ETF) might go in the future. Heck, investors also want to know where a future might be in the future.
Well, step up and take a closer look at volatility, because volatility, and only volatility, can provide a clue to what the future holds. Volatility can show where a stock might be at any point in the future. All it takes is some middle school math.
Here’s how.
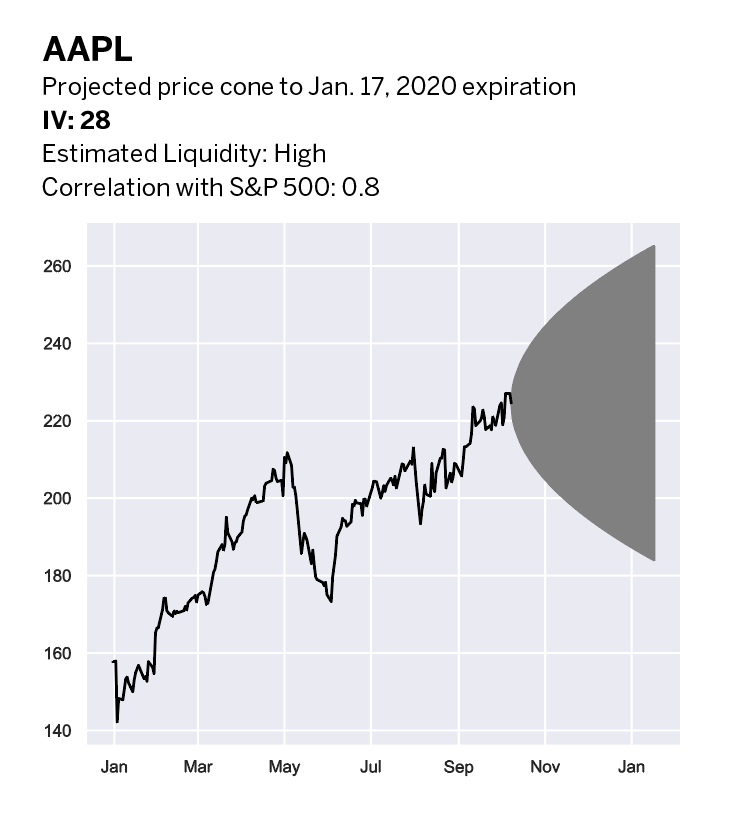
A trading platform like tastyworks might show that Apple (AAPL), for example, has a 28% volatility. That means Apple has a 68% probability of being somewhere between up 28% and down 28% in one year. With Apple at $220, that means between about $171.90 and $281.60. The discussion will turn to that 68% number, but first understand that volatility is expressed in annual percentage terms and gives a range of potential stock prices.
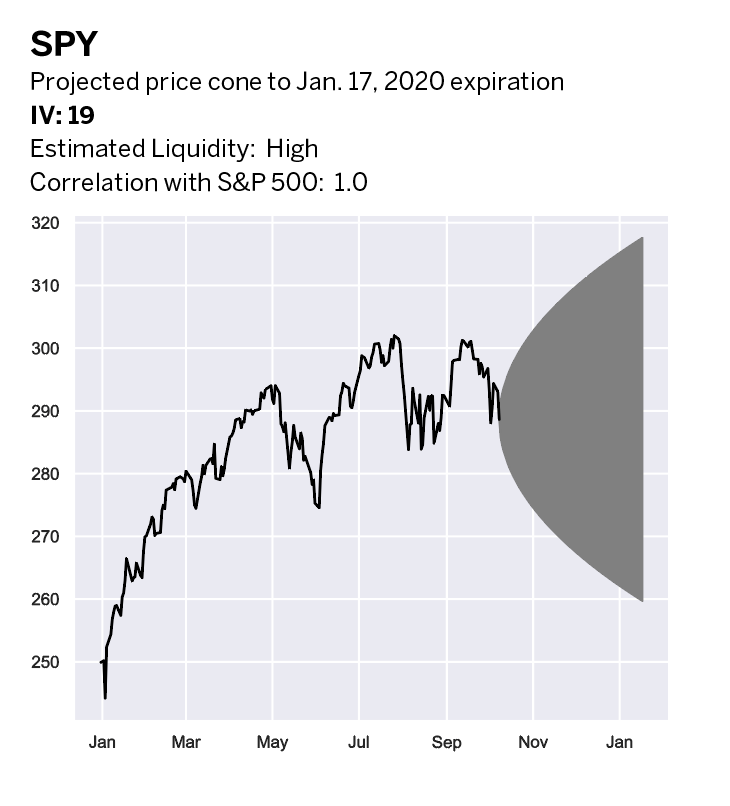
The reason for that convention is that it enables investors to compare the volatility of one stock or index to another without having to wonder if it represents one day’s, one week’s, one month’s or one year’s worth of movement. So, Apple, with 28% volatility, is more volatile than Google (GOOGL), with 20% volatility, and less volatile than Tesla (TSLA) with 50% volatility. Volatility in annual percentage terms enables investors to make apples-to-apples comparisons between stocks and indices.
But most investors don’t want an estimate of the range in one year. They need a range that matches the timeframe for a particular trade, whether it’s one day, one week, one month or anything else. To arrive at that, they can convert the annual volatility into that different timeframe. Simply multiply the volatility by the square root of the number of days in the future divided by 365. Huh? Read on.
Volatility is really a standard deviation. Remember from college statistics class that the standard deviation is a number that tells how much the individual data points of a sample vary around the sample’s mean. Translated into the trading world, the standard deviation (i.e. volatility) tells how much the price of a stock might move up or down from its current price. Lower volatility means that a stock likely won’t have big up/down swings (low data variance), and higher volatility means that a stock is more likely to have big swings (high data variance).
Remember that the standard deviation is just the square root of the variance of the data. Variance is the average of the squared differences between each data point and the average. Don’t just take the average difference because the points above the average would offset the points below the average and give an incorrectly low estimate of the data’s variability. For example, a stock that moves up 1% one day and down 1% the next would have 0% volatility if one just added them up, which conveys the idea that the stock doesn’t have any volatility at all. To get around that, each data point is squared to make it positive. The variance is the average of those squared percent changes.
Now, here’s the important step. Variance has a linear relationship to time. If investors calculate the variance of the percentage changes in a stock’s price for one year, they can double the variance to see what it would be for two years or halve it for six months. But variance isn’t a useful number in itself because no one trades squared stock prices. Take the square root of the variance to get the data back to the scale that’s usable. The square root of the variance is the standard deviation. And if variance has a linear relationship to time, then the standard deviation has a square root relationship to time. That’s why one needs to adjust annual volatility by the square root of time. That’s the theory. Let’s get to the bottom line.
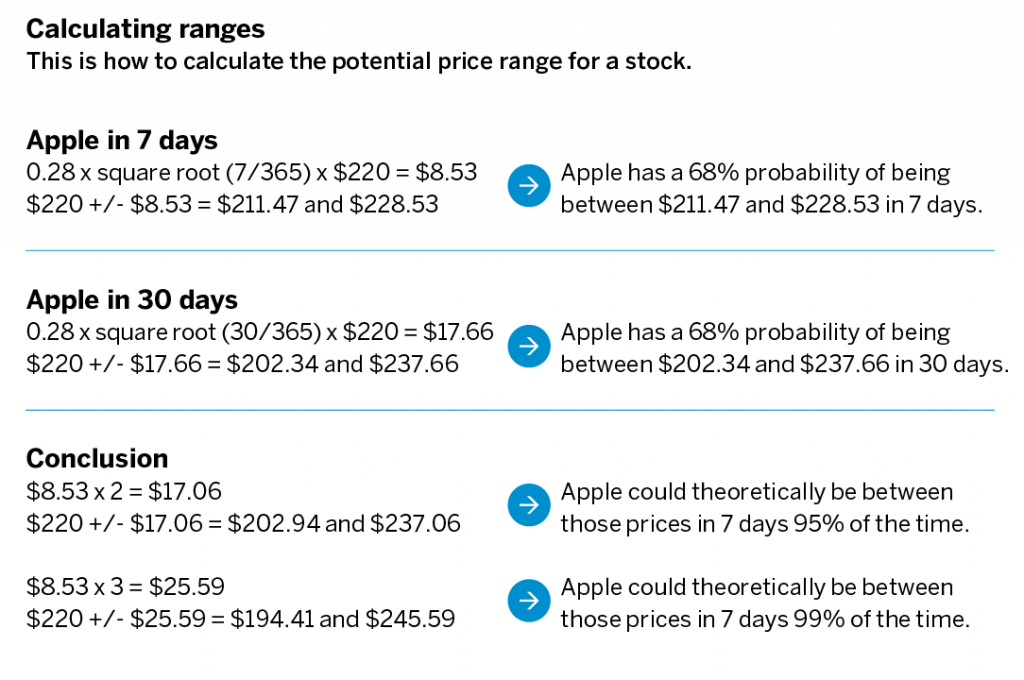
To see the potential price range for Apple in 30 days, multiply 0.28 by the square root of 30/365, then multiply that by the stock price. Add and subtract that number from Apple’s price to see the theoretical range. (See “Calculating ranges,” below.)
Do this for any number of days to match the trading timeframe.
Now, one standard deviation gives a 68% range, two standard deviations give a 95% range and three standard deviations give a 99% range. To get the 95% and 99% ranges, multiply the number from the first step by two or three, and add and subtract it from the stock price (See “Conclusion” in “Calculating ranges,” above.)
Using volatility that way provides context to an expectation of what a stock might do, or the price target determined for it. A target of $225 for Apple in seven days is well within statistical likelihood. A target of $250 in seven days is outside of three standard deviations and isn’t very likely. Create trading strategies around this information and quantify the potential for success.
That’s the luckbox way.
Tom Preston, luckbox features editor, is the purveyor of all things probability and the poster boy for a standard normal deviate.