Sunshine Securities
Only 0.014% of the solar energy reaching Earth is converted into usable power. That leaves plenty of room for improvement, and companies are rushing to meet the challenge.
Let’s examine the securities of five of those firms from a charting perspective. Ranking charts requires subjective judgment, but we’re presenting them in what we consider descending order from the strongest to the weakest.
The charts aren’t accompanied by commentary on company history, products or prospects. Instead, we’re observing how the stocks rose or fell in the past—and what that suggests about the future.
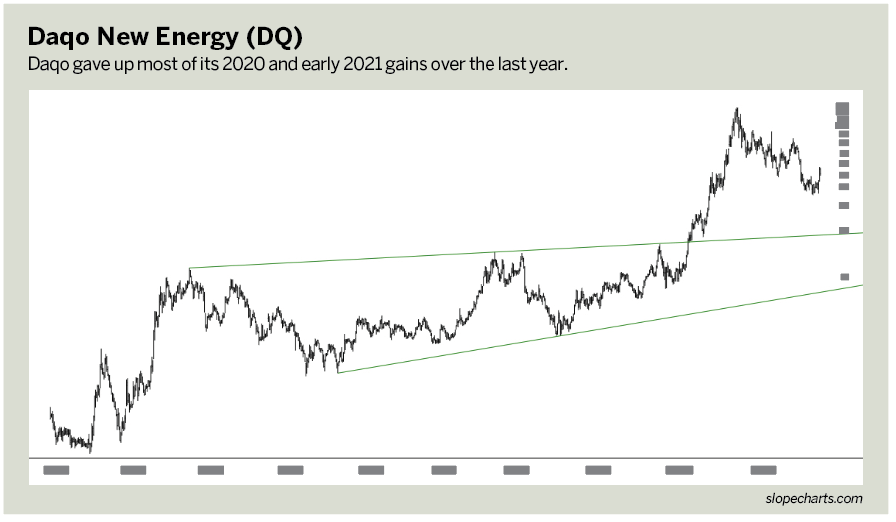
Daqo New Energy (DQ)
This company has been in a general uptrend for virtually its entire existence as a publicly traded entity, with the exception of its first couple of years.
It formed an exceptionally clean cup-with-handle pattern from 2014 through 2019, and its breakout from this pattern produced a remarkable 500% increase in a short time. The sheer magnitude of the bullish setup made the ascent sharp, powerful and almost uninterrupted.
Over the past year, however, the stock lost most of its gains. Should it continue to erode, it might create an appealing new buy point if the stock finds stability at the trendline.
That’s the same line that acted as resistance for so many years and is now serving as support. This stock’s chart is by far the healthiest of the group, in spite of its severe recent drop.
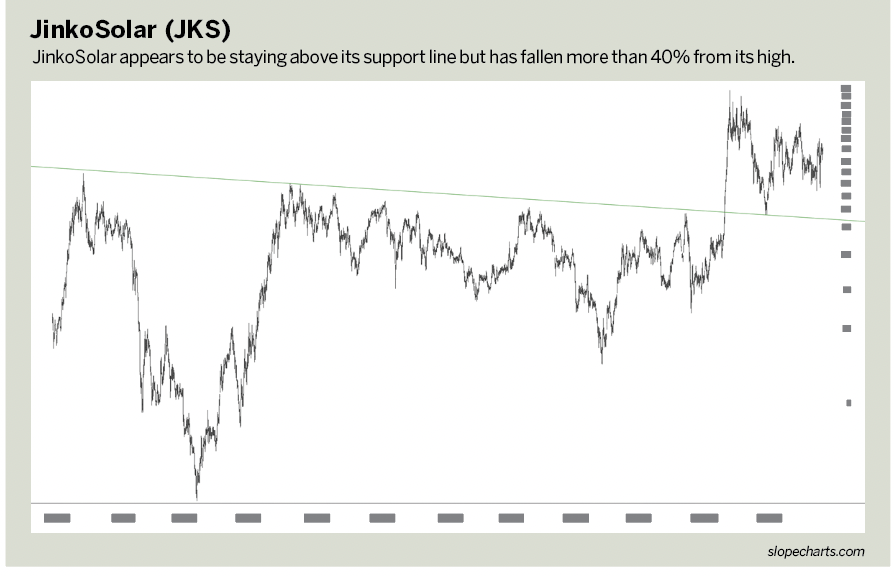
JinkoSolar (JKS)
Like Daqo, the JinkoSolar chart had a strong breakout from a long-term resistance line. However, a couple of things make this breakout less impressive.
First, the trendline was descending, indicating a stock that was slowly losing strength instead of gaining it. Second, it had only a short-lived breakout.
Despite instability, the stock at least held above the trendline, affirming its role change from resistance to support.
It has been consolidating for many months in a relatively tight range, and the single trendline on this chart can be considered a very important test of the long-term viability of JinkoSolar as a long position.
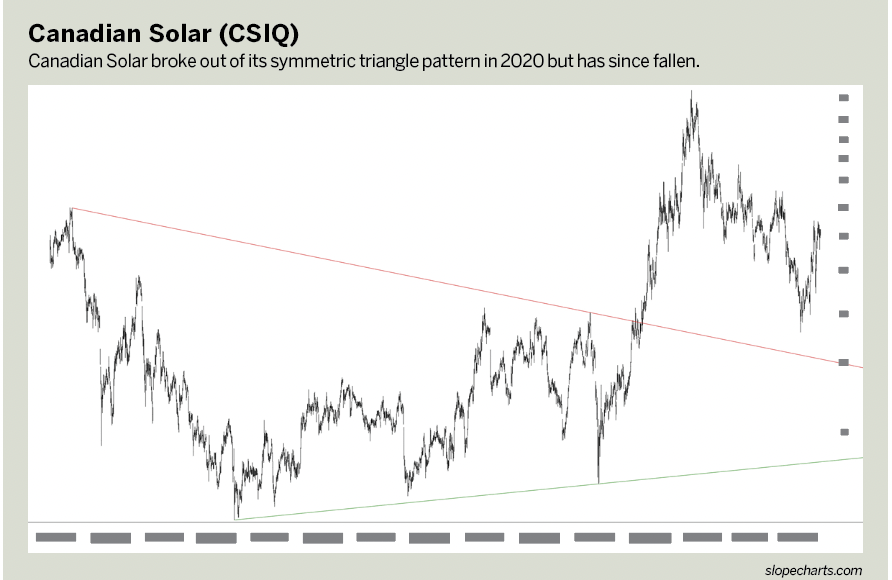
Canadian Solar (CSIQ)
This stock has a striking history, trading within a wild range for more than a decade and a half. The price of the stock wasn’t any different in 2022 than it was in the year 2008, even though it had been through its own private series of bull and bear markets for years.
In spite of this dynamism, it did sport a rather clean symmetric triangle pattern from 2015 through 2020, which provided the opportunity for a hearty bullish breakout.
The stock tripled in a few months. But like JinkoSolar, it lost virtually the entire value of the breakout afterward.
As with JinkoSolar, its disposition toward its supposed support line is important. If it stays above this line, this stock could pull up and away from that triangle once again in the long term.
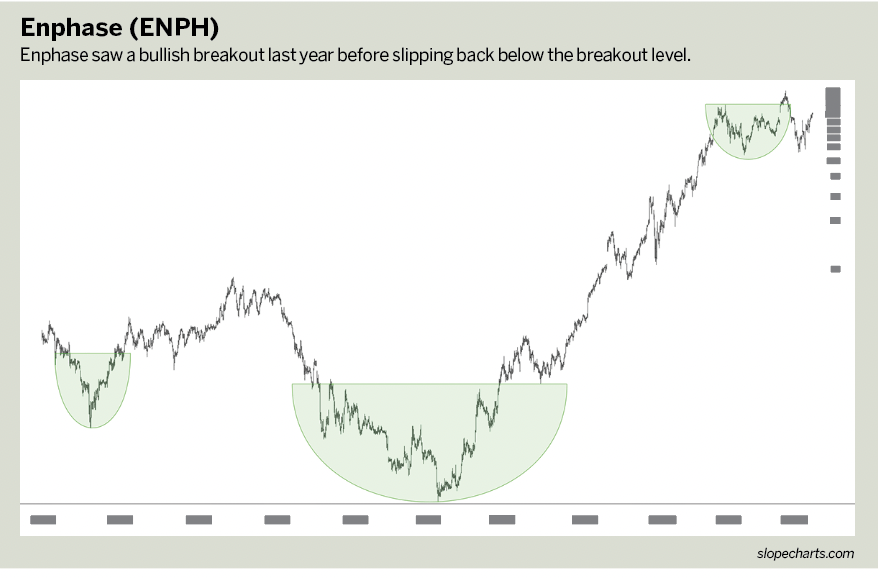
Enphase (ENPH)
Here’s an interesting situation. This stock would probably be at the top of the list were it not for a recent failed bullish breakout.
From 2015 through 2018, Enphase created a clean base pattern (tinted in green on the chart on the right) and then launched into a multi-year gargantuan percentage gain in price. It stalled out for about a year but appeared to be forming another leg up in what had already been a spectacular run-up.
The stock did break out to lifetime highs from this smaller pattern. But within weeks, it not only fell back beneath the breakout level but also slipped below the pattern altogether and started a serious descent of more than 50%.
Although this stock may be consistent in the long term, it’s clear that the bullish run it had from 2017 through 2021 has been short-circuited, and its failed bullish breakout surprised and disappointed the stock’s newer buyers.
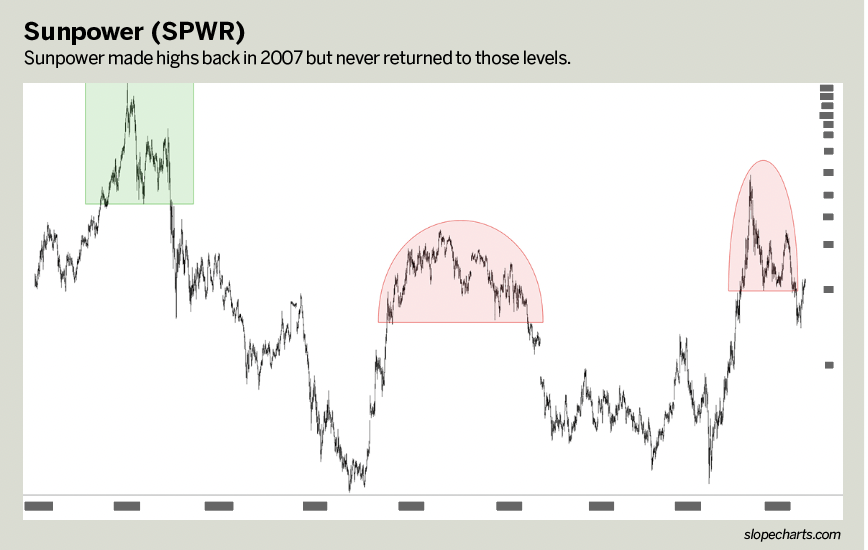
Sunpower (SPWR)
Sunpower rounds out the list. It landed at the bottom for two reasons. First, it’s been a losing stock for its entire price history. Although 2005-2006 was good for the stock, it has spent nearly two decades meandering around a large price range, always well below its 2007 level.
It had three thrusts higher, each followed by a severe price drop. Long-term holders of this stock are nothing but disappointed, and recent price action suggests yet another move into the single digits.
Should it reach the kinds of lows witnessed in 2011 and 2019, it might be worth considering a purchase.
A long, cold lonely winter
It seems inevitable that the solar industry will become a bigger part of life. The technology is improving, the sun isn’t going anywhere and oil prices are skyrocketing.
But from an investment perspective, this isn’t a golden opportunity to leap into these securities.
Still, the long-term history of these stocks provides insight into what would constitute an appealing purchase price at levels with better risk/reward ratios than traders are seeing
elsewhere these days.
Tim Knight has been using technical analysis to trade the markets for 30 years. He’s the host of Trading Charts with Tim Knight on the tastytrade network and offers free access to his charting platform at slopecharts.com. @slopeofhope