The Limits of Standard Deviation
Why use standard deviation to look at past stock prices when options provide a window into what’s to come?
One of the easiest ways to quantify risk is by observing standard deviation, which is a fancy way of quantifying how much a stock has moved.
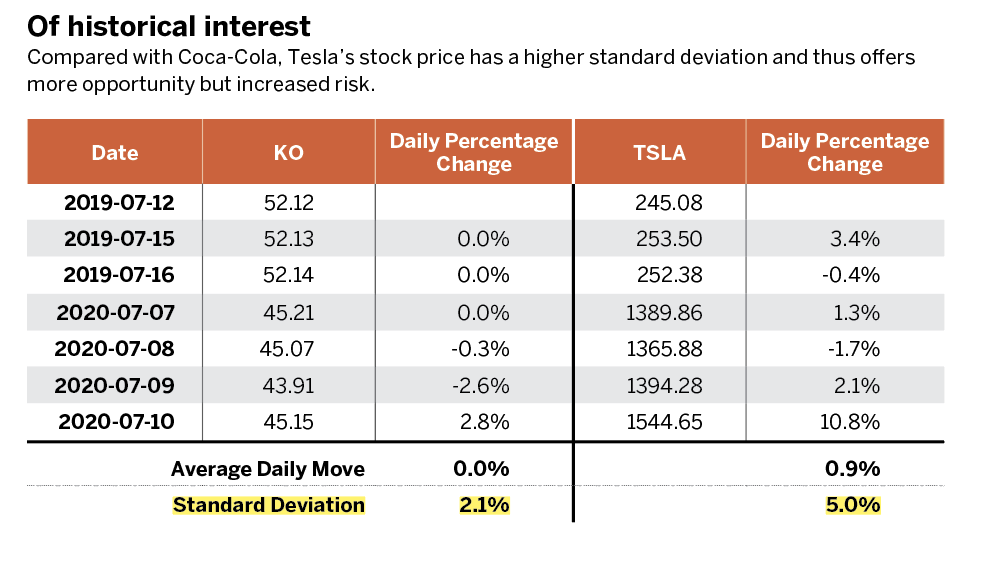
To calculate a stock’s standard deviation, take all the prices over the past year and apply a daily percentage change. Then apply a standard deviation to the data. (See “Of historical interest,” below.)
The standard deviation states that Coca-Cola (KO) moved an average of 0% per day and had a standard deviation of 2.1%. On the other hand, Tesla (TSLA) moved an average of 0.9% per day and had a standard deviation of 5.0%. So, Tesla has more risk and thus more opportunity.
Opportunity arises with a stock that is moving around in price because it enables an options trader to use more techniques to make money when it goes upward, downward or sideways.
As a general rule, standard deviation is an interesting concept for traders—but standard deviation’s practical use for a trader is limited, especially in a fast-moving market. It explains what has already happened. Traders can gain the same general information by simply looking at a chart. The stock that moves around more has more opportunity and therefore more risk.
To get a real-time estimate of risks, look at options. Options are insurance, and insurance is priced on “expectation.” The greater the risk of loss, the greater the cost of the insurance.
Thus, options for strikes are priced based on thousands of people’s desire for insurance. The greater the desire, the greater the costs.
This cost is plugged into a formula, and the output is the stock’s implied volatility. The good thing is that any good trading software will provide that number.
Take a look at the implied volatility of Tesla options for the July 17 and July 24 expirations in “Wild fluctuation,” below.
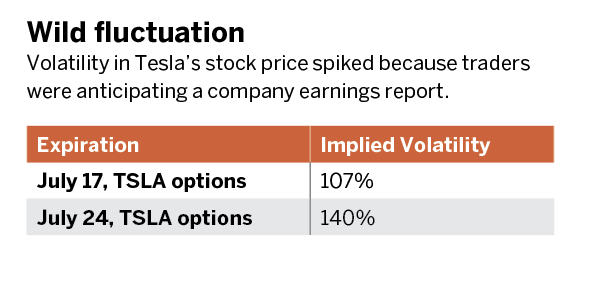
The scale is annualized—so Tesla, based on the July 17 options, is expected to moveeither up or down 107% over the next year. Look now at the 140% implied volatility of the July 24 expiration. Why the huge increase when July 24 happens only one week later?
Earnings occurred on June 22. Stocks tend to move on their earnings date, which often explains the largest movement of a stock, and July 17 expiration isn’t affected by that date, where the July 24 is affected, causing a 30% increase in the annualized move.
This is what makes implied volatility really useful for a trader. It provides a forward-looking view of what the “market” is expecting.
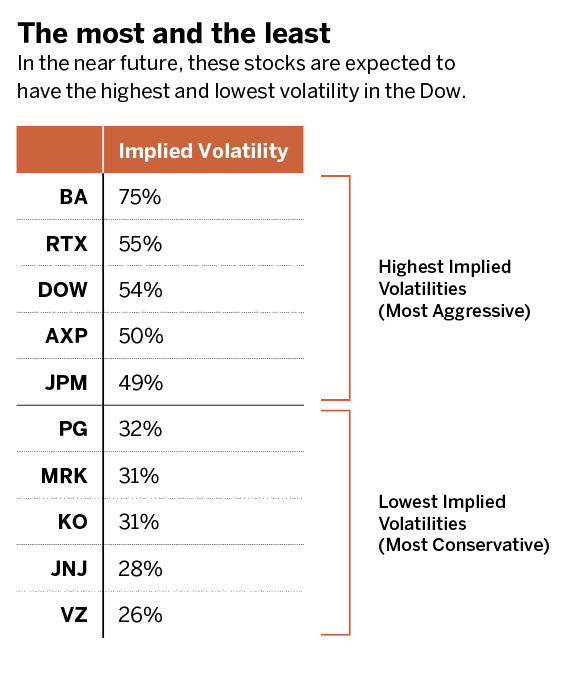
Which stocks in the Dow Jones are seeing the most and least forward-looking volatility? We provide the list in “The most and the least,” below.
Michael Rechenthin, Ph.D., aka “Dr. Data,” is the head of data science at tastytrade. @mrechenthin

