Defending Against a Declining Dollar
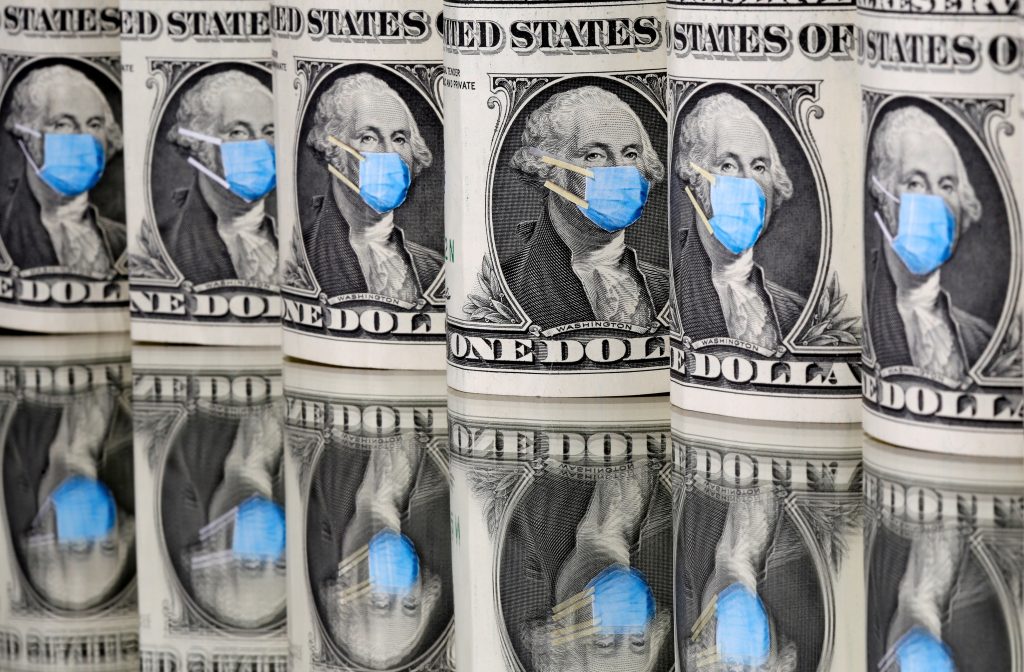
Dropping to 2.5 year lows against a broad basket of international currencies, the U.S. dollar appears to be closing 2020 on a sour note.

The U.S. dollar is plumbing fresh 2020 lows, which has many investors and traders wondering if recent losses in the world’s best-known currency could be indicative of bigger problems in the financial sector.
The last time the greenback slid to this level (spring of 2018), the U.S. stock market entered a period of heightened volatility and suffered a 6% correction. That was March/April of 2018, roughly 2.5 years ago, when the S&P 500 dropped to about 2,640.
At that time, the U.S. Dollar Index (DX-Y.NYB) was trading around 89, which is slightly below where the “DXY” is trading today.
There’s no guarantee, of course, that a drop in the value of the dollar precipitates a reciprocal decline in the stock market. The historical correlation between the U.S. dollar and the S&P 500 is only about 40%, meaning that 60% of the time, they move independently of each other.
The caveat is that during periods of heightened volatility correlations can trend toward the higher end of their historical spectrums—one reason that the dollar and S&P 500 may have moved in a highly correlated fashion during spring of 2018.
As many are aware, the dollar has been under pressure this year because the U.S. government has been forced to flood the system with liquidity in order to support the economy. With trillions of extra dollars floating around in the system, supply-demand dynamics dictate a corresponding decline in the nation’s currency.
The chart below illustrates how the dollar has experienced a pronounced downdraft this year, as the government has flooded the system with liquidity in the form of both quantitative easing and fiscal stimulus.
Beyond its performance to date, the near-term outlook for the dollar is also weak because more dollars are poised to enter the system via a second stimulus package.
The next move down, if it comes, will likely hinge on the size of that stimulus. Current estimates suggest a coronavirus relief package of somewhere between $500 billion and $1.5 trillion will be passed by Congress in the coming weeks.
As most are aware, the value of a given currency is typically quoted relative to another currency, or a basket of currencies. For example, The DXY measures the value of the U.S. dollar relative to a basket of currencies—a group that constitutes the country’s closest trading partners.
Against that basket of currencies, the dollar is down roughly 12% from its 2020 highs. As illustrated in the previous chart, the dollar started slumping in March, when the first U.S. economic stimulus package was deployed.
Looking at the dollar’s performance relative to other prominent global currencies in 2020, it is down 6% against the Chinese yuan, down 8% against the euro and basically flat against the British pound. The dollar’s somewhat surprising collapse against the Chinese yuan in 2020 is shown below.
Investors and traders seeking to express an opinion on the dollar can do so in a multitude of ways, ranging from the foreign currency markets, the futures markets, and even exchange-traded funds (ETFs). The Small Exchange, which launched earlier this year, also offers U.S. dollar exposure.
To learn more about dollar-focused trading strategies, readers are encouraged to review the following tastytrade programming:
- Futures Measures: Background on the U.S. Dollar Index
- Small Stakes: Why Add U.S. Dollar Exposure to the Portfolio?
- Small Stakes: How to Hedge Foreign Exchange
This December, give the gift of Luckbox and get a free Luckbox T-shirt! See SUBSCRIBE or UPGRADE TO PRINT (upper right) for more information.
Sage Anderson is a pseudonym. The contributor has an extensive background in trading equity derivatives and managing volatility-based portfolios as a former prop trading firm employee. The contributor is not an employee of Luckbox, tastytrade or any affiliated companies. Readers can direct questions about any of the topics covered in this blog post, or any other trading-related subject, to support@luckboxmagazine.com.


