Binary Events and the Odds of a 2020 Market Correction
When investors and traders hear the term “binary event,” they usually think of biotechnology companies that explode higher after FDA approval, or of a company that had its stock cut in half (or worse) due to mismanagement.
Axsome Therapeutics (AXSM), whose stock jumped from $45/share to above $80/share in mid-December is a good example of the former, while Bear Stearns and Lehman Brothers, both of which effectively went bankrupt during the 2008 financial crisis, are great examples of the latter.
In the trading world, dramatic developments that trigger big moves in an individual underlying, or the broader financial markets, are often referred to as “binary events.” In hindsight, such occurrences can easily be interpreted as absolute positives, or absolute negatives, through jagged moves on the historical price chart.
Stock indexes such as the S&P 500, the Nasdaq and the Dow are theoretically less susceptible to extreme binary moves because they comprise a large number of diversified companies. Single stocks, on the other hand, are more susceptible to binary moves because with such entities there’s nowhere for risk to hide—these stocks are bought or sold in immense volumes according to the prevailing sentiment in the wake of a critical event.
The above helps explain why the definition of a “binary event” is somewhat different for stock indexes as compared to single stocks, and also why risk (i.e. option premium and implied volatility) is priced so differently for each.
A 2020 correction?
The Dow Jones has only three times moved more than 10% in a single session (opening price to closing price, same trading day), including:
- October 19, 1987: -22.61%
- October 28, 1929: -12.82%
- October 29, 1929: -11.73%
A market “correction” is often defined as a pullback of at least 10%, meaning that in 1929 and 1987, markets corrected in a single day. When considering that the Dow’s history covers over 120 years of trading, the fact that it fell by more than 10% only three times is a testament to the rarity of such occurrences.
Looking at more recent history (the last 30 years), there have been zero instances in which the Dow Jones has dropped at least 10% in a single trading session. However, there were two periods during that span in which stock markets experienced serious corrections. Those would of course include 2000-2002 (the dot-com bubble) and 2008-2009 (the financial crisis).
During those two corrections, there were four trading days in which the Dow Jones moved more than 7% in a single day (Sept. 17, 2001, Oct. 9, 2008, Oct. 15, 2008, and Dec. 1, 2008).
The above helps explain why longtime market participants get especially sensitive to downward movement in the markets during the fall, because each of the Dow’s seven biggest single-day downside moves occurred in September or October. The fact that the dot-com bubble and the 2008 financial crisis only saw four total days in which the Dow Jones moved down more than 7% is further evidence that such moves are extremely rare.
Fast forwarding to the present day, the U.S. stock market has been on quite a run since the last serious market correction in 2008-2009. During that time, the S&P 500 bottomed out around 676. Recently, the S&P 500 closed near 3,250, representing an increase of over 380% in just under 11 years.
While long-term holders of equities have to be pleased with 2019, one has to think there’s a good number of contrarian traders out there sharpening their knives in anticipation of the next big market correction.
At some point in the future, the current market upswing will be reflected upon as an impressive bull run that had a definitive starting point and ending point. It’s almost guaranteed that the future “end point” to the current bull market will catalyze a fresh round of books and movies in the same vein as The Big Short.
So what are the chances that pullback occurs in 2020?
While the answer to that question is highly subjective, the tastytrade financial network compiled a wide range of historical market data to shed further light on the possibility for a market correction in 2020.
As one can see in the graphic below, 2019 as a whole saw the risk of a down day in the S&P 500 drop below the historical average:
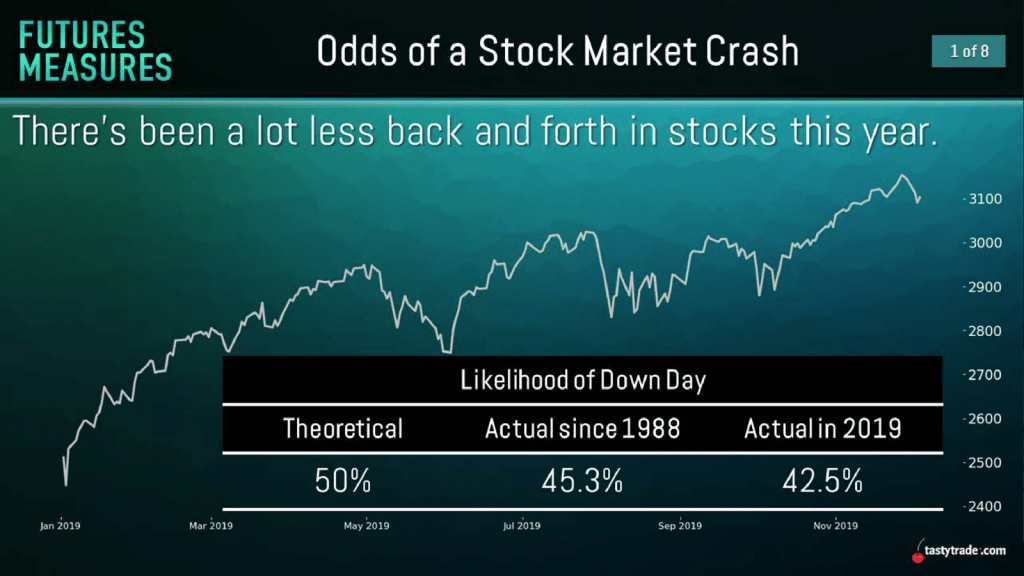
According to the above data, the theoretical chance for an “up” or “down” day in the S&P 500 is normally 50%. This is the same theoretical probability associated with flipping a coin—a 50% chance it will result in a “head” or “tail.”
As shown above, when comparing the last 30 years of historical data in the S&P 500 (8,000 trading days) to 2019, the actual chance of a down day during the 2019 trading year dropped below the 30-year average.
Delving further into those 8,000 trading days of data, the tastytrade research team ascertained several other important takeaways. Instead of looking only at the chances of a single “down” day, the research team at tastytrade broke down the chances for consecutive down days.
The charts below highlight the theoretical likelihood for varying numbers of consecutive down days in the S&P 500, as well as the actual number observed. This data is expressed in percentage terms, as well as the number of instances:
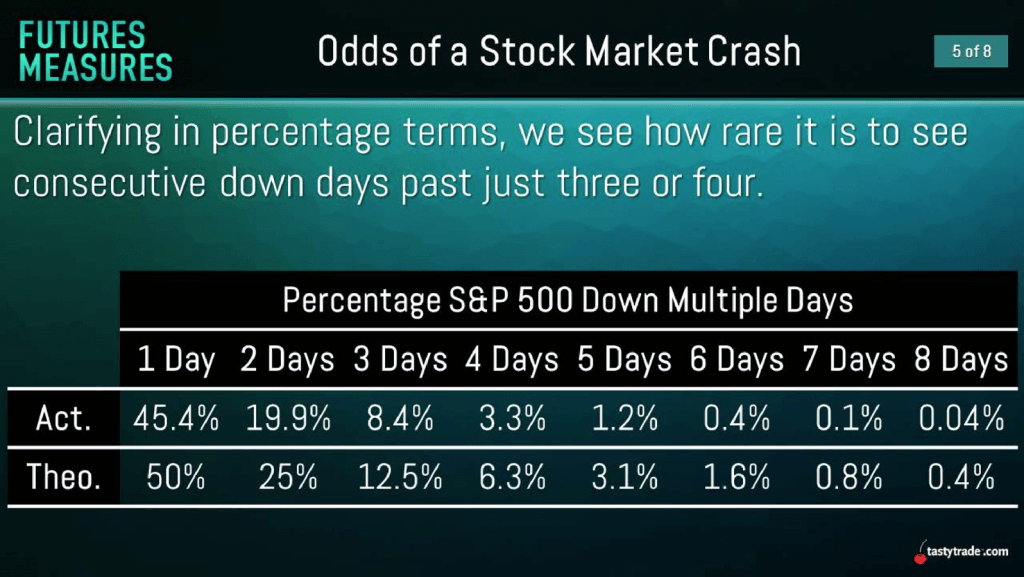
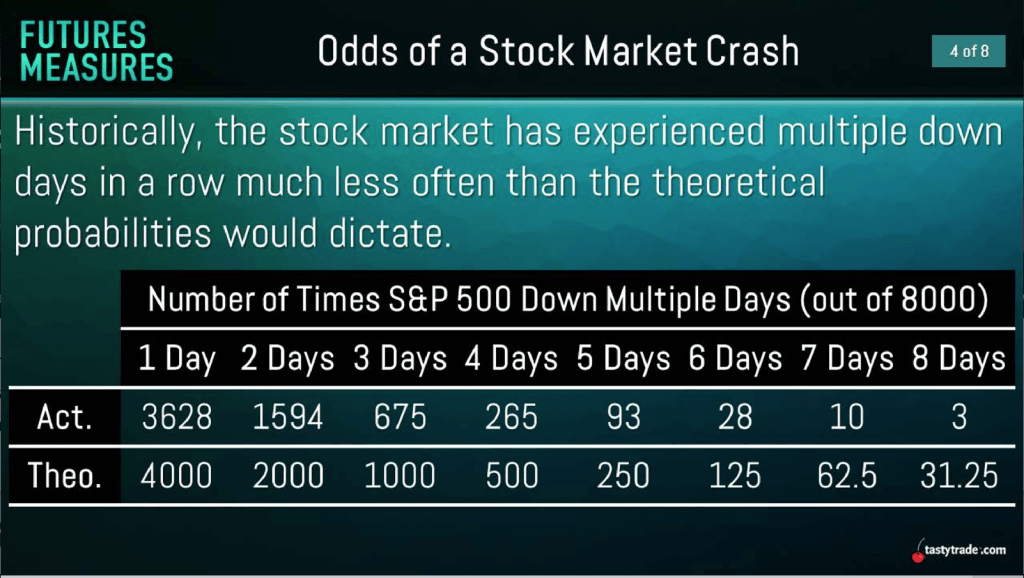
Per the graphics above, one can see that the actual percentage of consecutive down days in the S&P 500 over the last 30 years was consistently lower than the theoretical projection.
Somewhat surprisingly, there were only three instances in the last 8,000 trading days in which the S&P 500 saw eight consecutive days of declines. Moreover, the theoretical projection called for 31 such instances, on average.
As highlighted earlier, there were also only four trading days during that same span that saw the Dow Jones drop by more than 7% in a single session.
Putting that all together, historical data seems to indicate there isn’t a high probability that the U.S. stock market crashes in 2020, especially not in a single session. On the other hand, if the Dow Jones does move more than 7% in a single session during the 2020 trading year, traders may want to pay attention.
For a stock index, a 7%+ move is effectively a binary event.
Since the inception of the Dow Jones in 1896, there have been 19 total instances in which the index has moved down more than 7% in a single session. Four of those 19 instances were observed in the last two decades, amid calamitous, extended corrections.
Sage Anderson is a pseudonym. The contributor has an extensive background in trading equity derivatives and managing volatility-based portfolios as a former prop trading firm employee. The contributor is not an employee of Luckbox, tastytrade or any affiliated companies. Readers can direct questions about topics covered in this blog post, or any other trading-related subject, to support@luckboxmagazine.com.