Tracking the SPY in Complacent and Chaotic Markets
Extreme trading conditions can at times be profitable and at times painful, but they are also great avenues for learning.
Because the last major market crisis occurred over 10 years ago, many active traders in the current marketplace are likely seeing the VIX above 40 for the first time in their careers.
But one mustn’t forget that veteran traders are also seeing some things for the first time in 2020, including the highest-ever volatility in crude oil (OVX) and negative-priced crude futures, to name a couple.
One concept that’s been clearly demonstrated in the current market environment—to both inexperienced and experienced traders alike—relates to trading ranges, a term that is often referred to by market insiders as “standard deviation.”
Standard deviation is an important risk (and reward) statistic because it reports on the relative volatility of a given underlying, specifically the spread of an asset’s price from its theoretical mean.
When prices are swinging wildly, standard deviations are relatively higher as compared to when prices are trading in a tight range, the latter of which is a characteristic of low standard deviations.
While many options traders understand and utilize implied volatility in their decision-making process, fewer of them delve into standard deviation.
Implied volatility itself is defined as a one standard deviation annual move. A one standard deviation move encompasses the range a stock should trade 68.2% of the time. That information is fairly powerful and provides important insight into a potential trade.
For example, imagine hypothetical stock ABC is trading for $200 with an implied volatility of 10%. That means ABC has an implied 68.2% chance of trading between $180 and $220 during a one-year timeframe ($200 x 0.10 = +/-$20).
Additionally, it implies there’s a 95.4% chance that ABC will trade between $160 and $240, and a 99.7% chance that it will trade between $140 and $260, over a one-year timeframe.
This example also helps illustrate how the potential trading range of ABC over the next year would theoretically change if implied volatility were to increase or decrease.
Circling back to the current market environment, one might wonder how the standard deviations (i.e. expected trading ranges) of the best-known stock market indexes have changed since the start of the coronavirus crisis.
This also begs a second question: What is the normal range (i.e. standard deviation) of so-called “complacent/dull” markets as compared to the more “volatile” market conditions observed in 2008-2009, late 2018 and early 2020 (to name a few)?
Fortunately, these topics were covered in a recent episode of Market Measures on the tastytrade financial network. Specifically, tastytrade conducted a market study that isolated and compared the trading ranges of “dull” markets (i.e. low volatility) to those of “crisis” markets (i.e. high volatility).
The summarized data from this comprehensive study helps illustrate how standard deviations widen when market volatility increases, and also provides insight into the “average” percent daily moves that have been observed in each respective environment.
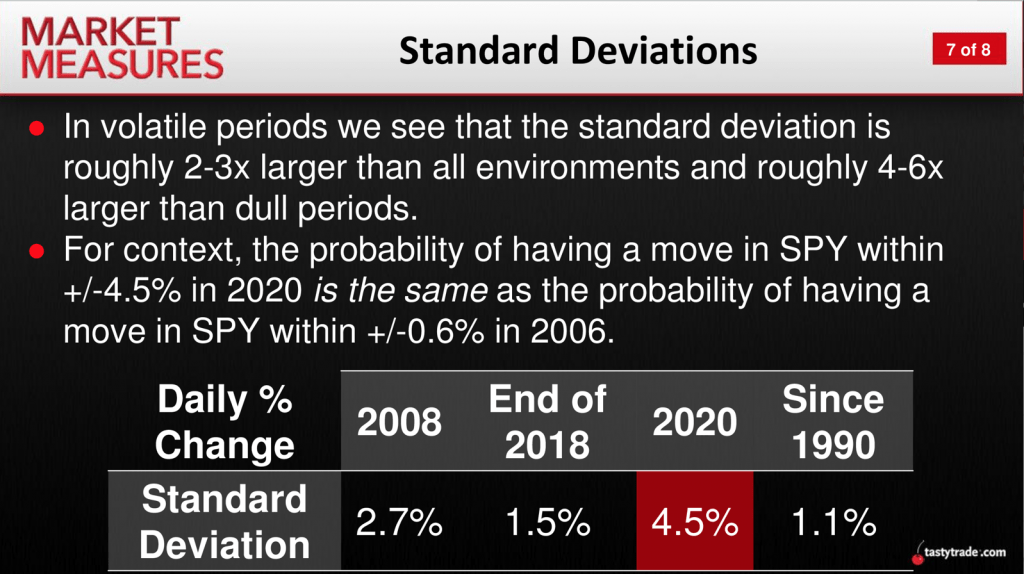
The first slide below summarizes average trading range data in SPY during “dull” markets, while the second slide summarizes average trading range data from volatile markets:
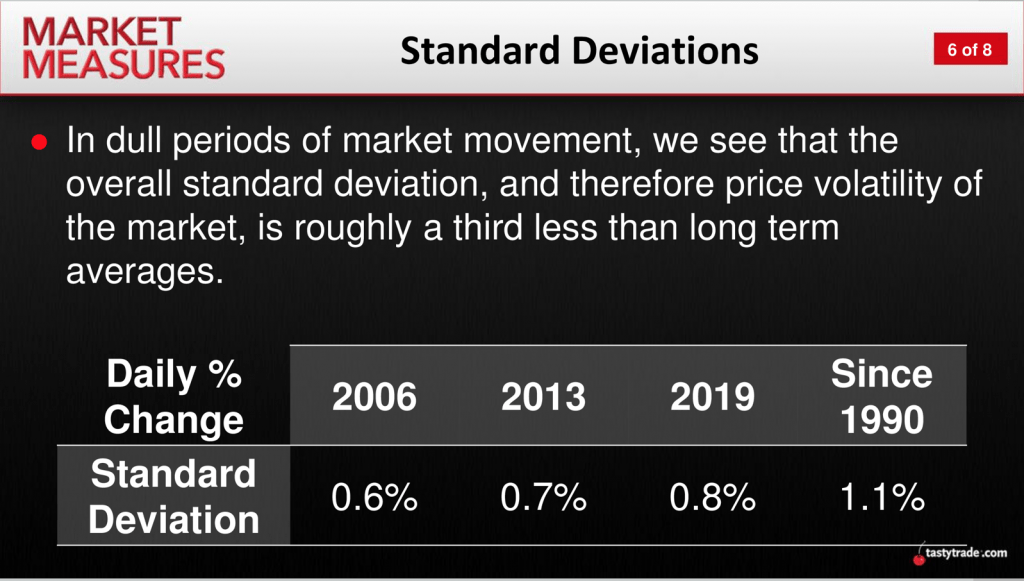
As one can see on the far right in both slides, the overall average daily trading range in SPY since 1990 has been 1.1%, which essentially indicates that SPY will trade within a daily range of between 1.1% higher and 1.1% lower about 68% of the time (all occurrences).
Furthermore, as might be expected, the average standard deviations are lower for “dull” markets and higher for “volatile” markets, per the data highlighted above.
But what’s particularly interesting is that this market study provides a helpful foundation upon which traders can build a better understanding of just how different each market environment is from the other, and to what degree.
Likewise, the second slide also reveals just how volatile 2020 has been in terms of widened trading ranges, especially as compared to other recent “volatile” market environments (2008-2009 and late 2018).
Based on this research, tastytrade estimates that volatile markets have standard deviations that are four to six times higher as compared to standard deviations in dull markets.
Looking at this important takeaway in a slightly different way, that means the probability of a +/-4.5% move in SPY during 2020 is theoretically the same as the probability of a +/-0.6% move in SPY during 2006.
These stark differences help explain why, in “volatile” markets, implied volatility must go higher—because the options market must compensate for the increased likelihood of larger magnitude moves.
Along those lines, one can see why the equity markets must sustain those large swings to rationalize heightened levels of implied volatility. Because if realized volatility (i.e. actual volatility) starts dropping, high options premiums can no longer be justified and, more importantly, will more than likely produce heavy losses for owners of such options.
To learn more about realized vs. implied volatility and how this data can be used when trading options, readers may want to review this previous episode of Ryan & Beef. The aforementioned episode of Market Measures focusing on SPY’s widening range in volatilite markets is also recommended when scheduling allows.
Sage Anderson is a pseudonym. The contributor has an extensive background in trading equity derivatives and managing volatility-based portfolios as a former prop trading firm employee. The contributor is not an employee of Luckbox, tastytrade or any affiliated companies. Readers can direct questions about topics covered in this blog post, or any other trading-related subject, to support@luckboxmagazine.com.