Trading ‘Vol of Vol’ and the VVIX/VIX Ratio
“Vol of vol” provides active investors with important insights into the current risk dynamic through metrics like VVIX, VIX, and the VVIX/Vix ratio

Investors and traders often reference a term called “vol of vol,” or the “volatility of volatility.”
A clear understanding of the “vol of vol” concept can provide market participants with additional insight into the risk dynamic in a given market.
Most commonly, the phrase “volatility of volatility” (aka “vol of vol”) refers to the CBOE VIX Volatility Index (VVIX). But this underlying shouldn’t be confused with the “regular” CBOE Volatility Index (VIX), as the two represent separate products.
The VIX is calculated using the implied volatility of options in the S&P 500. As implied volatility rises in S&P 500 options, so too does the VIX.
Alternatively, the VVIX is calculated using the implied volatility of out-of-the-money (OTM) put options in the VIX itself. That’s why the VVIX is often said to measure the “volatility of volatility.”
Practically speaking, the VIX gauges risk premium in S&P 500 options, whereas the VVIX gauges the risk premium in VIX options. Consequently, VVIX provides further insight to market participants on the current risk dynamic.
For context, the long-term average in the VIX is around 19, while the long-term average in the VVIX is about 88. During the spring of 2020, when the stock market dropped precipitously, the VIX set a new all-time closing high above 82 on March 16. On that same day, the VVIX spiked above 200, also setting a new all-time closing high.
Thinking through the mechanics of the VIX and VVIX, it stands to reason that as the VIX rises, the VVIX should also go higher (and vice versa). But the two don’t always move together. Thanks to research conducted by tastytrade, one can see how the two have moved relative to each other historically:
- VIX up, VVIX up: 34%
- VIX up, VVIX down: 13%
- VIX down, VVIX up: 11%
- VIX down, VVIX, down: 42%
Per the above data, the VIX and VVIX historically tend to move in the same direction roughly 76% of the time, and in different directions about 24% of the time.
To understand why the VVIX and VIX don’t always move together, it may help to imagine the following scenario. If VIX were to spike above 55 over the course of a couple of weeks, one can safely assume VVIX would also make a big move higher.
Now imagine that VIX dropped from 55 to 50. It’s possible that implied volatility in VVIX would not drop to the same degree, given that VIX at those lofty levels would still be well above its historical average. The implied volatility in VIX puts might remain firmly bid (i.e. a high VVIX value), given that VIX could still drop precipitously.
It should be noted that market participants also use the ever-changing relationship between VVIX and VIX to monitor the market’s prevailing risk dynamic—through a metric known as the “VVIX/VIX ratio.”
Historically, the VVIX/VIX ratio tends to be lower during periods of extreme volatility and higher during periods of relative complacency. For example, during that extremely volatile day on March 16, 2020, the VVIX over VIX ratio closed the trading day at about 2.5 (207/82 = 2.5).
In comparison, on Oct. 5, 2017, the VIX posted one of its lowest closing prices of all time at 9.19—a clear indication of market complacency. On that same day the VVIX closed trading just over 91—meaning that the VVIX/VIX ratio at the close of trading on Oct. 5, 2017 was almost 10.
In recent years, that means the VVIX/VIX ratio has ranged between roughly 2.5 (when market volatility was peaking) and almost 10 (when market volatility was historically complacent).
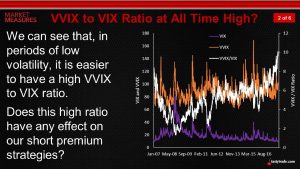
The chart below illustrates how the VVIX/VIX ratio spiked to highs back in 2017, during that historically complacent October.
As of today, the VVIX/VIX ratio stands at around 5.5 (111/20 = 5.5) suggesting that the current risk environment is closer to “normal,” as opposed to one extreme or the other.
Readers seeking to learn more about the “vol of vol,” and more specifically the VVIX/VIX ratio, are encouraged to review this previous episode of Market Measures when scheduling allows.
To follow everything moving the markets, readers can also tune into TASTYTRADE LIVE, weekdays from 7 a.m. to 4 p.m. CST.
Offer extended through April 1st: Subscribe to Luckbox in print and get a FREE Luckbox T-shirt!
See SUBSCRIBE or UPGRADE TO PRINT (upper right) for more info.