The End of the Rainbow?
Prospects for continued inflation may interfere with finding a pot of gold
The word “inflation” may not mean much to anyone who wasn’t around in the 1970s and early ‘80s. Ever since Paul Volcker successfully broke inflation’s metaphorical back during the first Reagan administration, the cost of goods and services has generally inched up only a couple of percentage points each year.
Sure, a few lurches—both up and down—have occurred along the way, particularly with news-sensitive commodities, such as oil. But for about 40 years, citizens of the United States really haven’t suffered the kind of angst about inflation that roiled the populace in the 10 years preceding Volcker.
That may be changing, however, with trillions of dollars in COVID relief reshaping the American economy. Some prices are surging, and when they’re not, the products themselves are simply getting smaller. Some call it “shrinkflation.”
One of the best sources for long-term data on the corrosive effect of price inflation on purchasing power is, ironically, the Federal Reserve, and the charts accompanying this article provide insight into trends stretching back to the creation of the Fed in 1913.
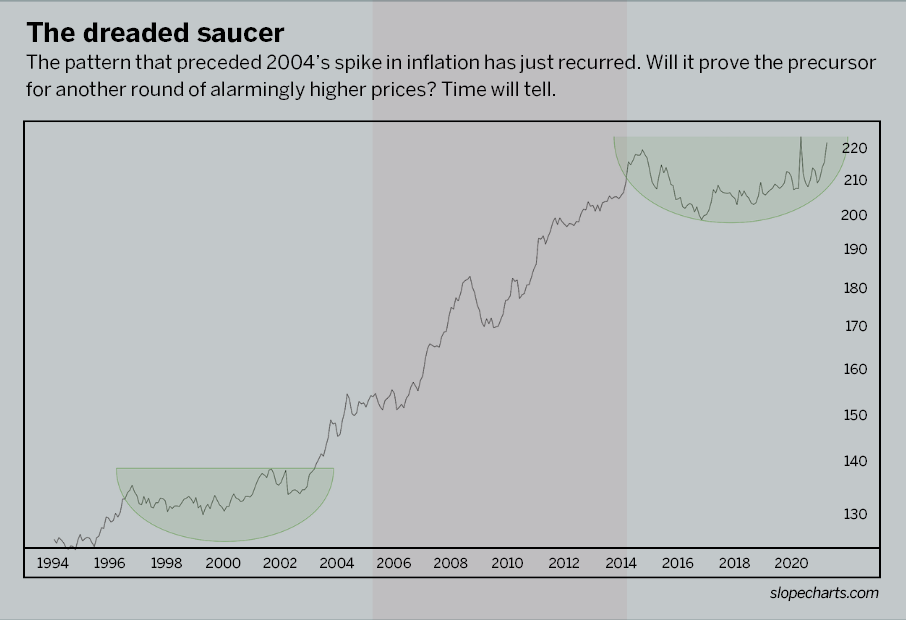
Commodities in a saucer
The government doesn’t provide a single, straightforward inflation number. Instead, it juggles all manner of historical data, with different granularities (monthly, quarterly, yearly), different calculations and different exclusions.
For example, the most frequently cited government report on inflation omits food and energy because their price changes are so volatile. It might seem important to convey such data, volatile or not, but most members of the public don’t dig any deeper than the headline number.
One important flavor of inflation data—the producer price index for commodities—draws upon data going back nearly three full decades to 1994. The chart’s price action from 2015 to the present looks awfully similar to what was happening between about 1996 and 2004, when prices began a powerful ascent.
Still, a single instance of a certain pattern yielding a certain result is far from conclusive evidence that the same thing will happen. What’s more, the powerful move in commodities from 2004 to 2008 occurred almost entirely because of extraordinary demand from the BRIC nations, a situation unlikely to repeat itself.
Yet this analog is worth keeping in mind as long as it remains intact—in other words, as long as prices don’t slip below the saucer formation already completed.
A trimmed calculation
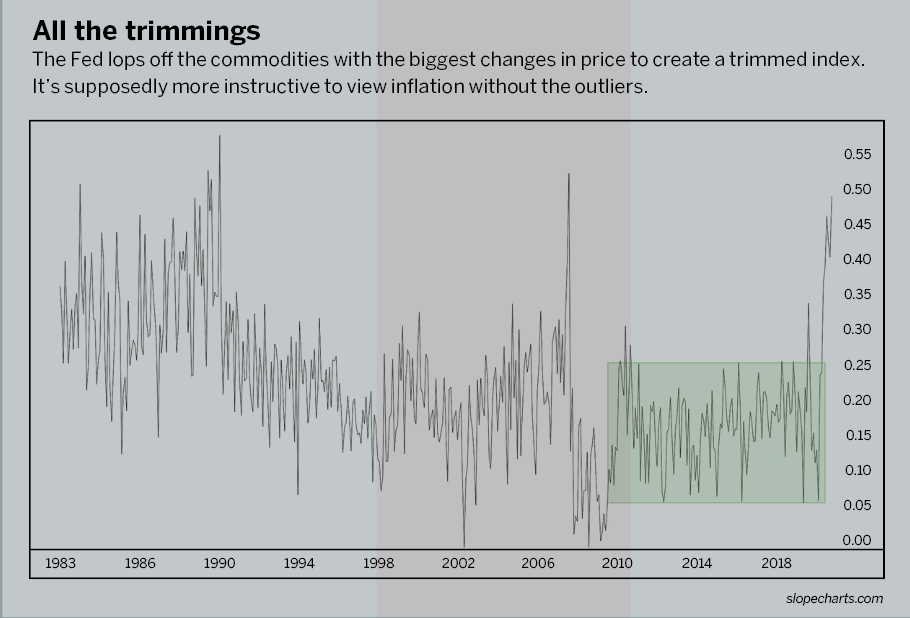
The U.S. government tracks a wide variety of inflation measures, and one of the most useful bears the clumsy name of 16% Trimmed-Mean Consumer Price Index.
This calculation, a creation of the Federal Reserve Bank of Cleveland, starts with a basket of products and “trims” the top 8% and bottom 8%, thus eliminating the outliers and retaining the other 84% to produce the trimmed CPI.
This seems more balanced than the more popular calculations that blithely ignore the rising costs of such outlandish luxuries as food and energy.
The first chart of the trimmed CPI shows monthly change. It may look wildly volatile, but it ranges from 0.0% to only about 0.5%. Those numbers might seem small, but they add up. In fact, a 0.5% monthly change implies a yearly change of 6%, which is quite high.
For the past decade, month after month, the figure came in between 0.05% and 0.25%, and usually around 0.1%, which is a remarkably tame CPI. Recent data, however, clearly shows the economy has left the shaded area behind, as the CPI has lurched out of this decade-long box into some of the highest levels of this time series.
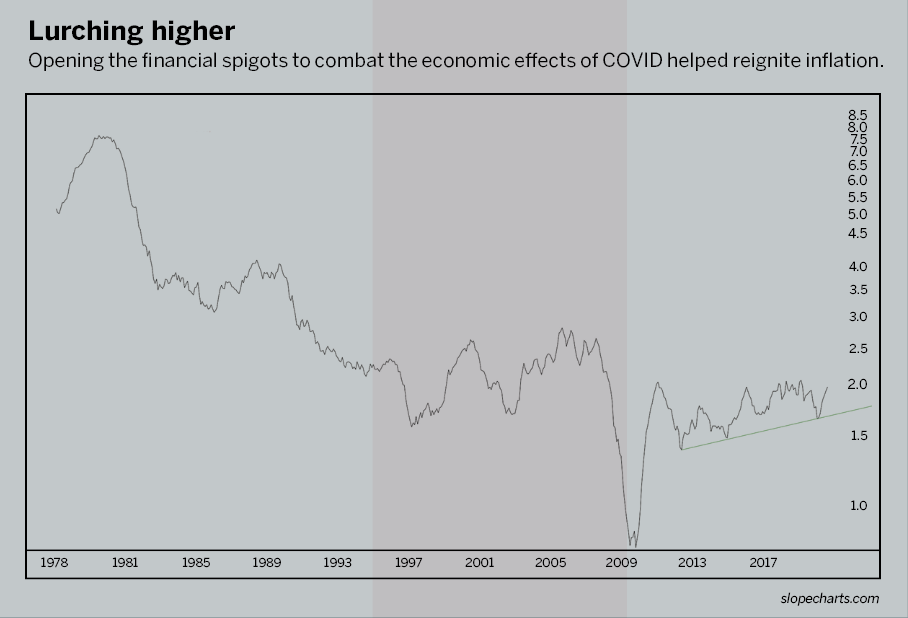
Month-to-month data rolls up into long, sweeping trends, which is what the next graph represents. This is the same 16% trimmed CPI except on a rolling annual basis.
Just before the financial crisis, the trimmed CPI was at about 3%. From 2007 through 2010, however, that figure plunged to nearly 0%, and the Fed became terrified of the “D” word: Deflation.
Throwing open the financial spigots to combat COVID, the Fed succeeded in reigniting inflation. Its oft-cited goal of 2% has already been reached, and it’s using other measuring sticks to show inflation has not quite achieved its target.
GDP and inflation
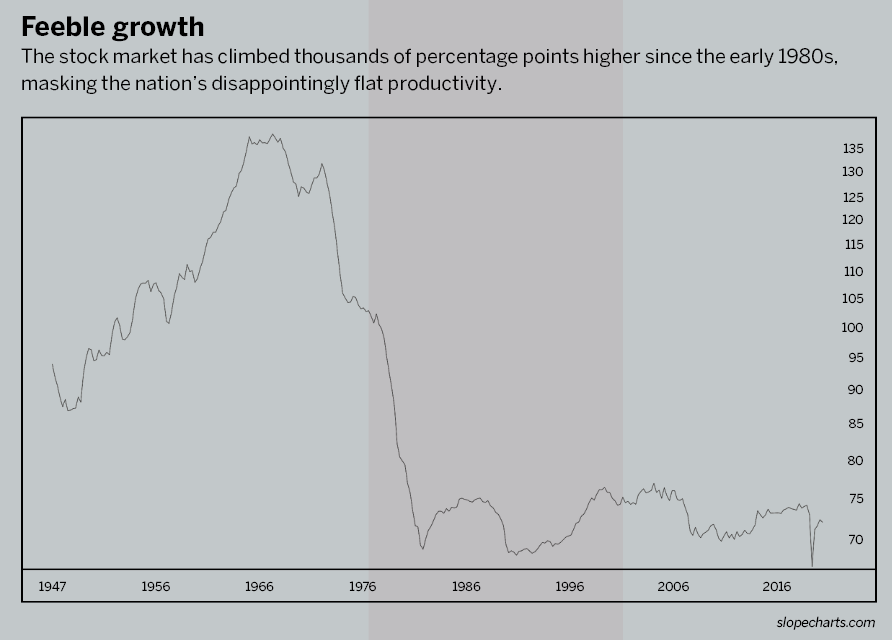
Combining two data sets lends perspective to a view of the long-term economy. Let’s divide the nation’s gross domestic product (GDP) by the inflation accumulated over the years, as measured by the Consumer Price Index. The resulting eye-opening chart breaks down into three time periods.
⊲ 1947-1968: The graph pushed steadily higher because GDP was growing powerfully enough to render inflation moot. It reflected genuine, not just nominal, prosperity and productivity.
⊲ 1969-1982: The chart went into free fall as surging inflation handily beat GDP. Although not shown here, the stock market performed poorly for most of those years, and by the early 1980s investors were becoming uninterested in trading stocks. But they were making money as prices soared for assets like gold and agricultural commodities.
⊲ 1982-present: It’s sobering that the graph has been meandering up and down in a relatively tight range for a full 40 years. In spite of a stock market that’s literally thousands of percentage points higher than the early 1980s, the nation’s productivity has remained terribly flat when inflationary forces are taken into account. Surging asset valuations have masked the reality that America’s explosive industrial growth ended before most of today’s traders were born.
Where the funds flow
The real question isn’t about inflation in the 19th century or how GDP compares to the CPI. Americans simply want to know if prices are going to keep going up.
It’s impossible to know for sure because of a wealth of uncertainties. One of the biggest is where those extra trillions in COVID cash are going to wind up. A tremendous stockpile of undeployed cash is sitting around in digital bank vaults, immaterial to the day-to-day economy.
The Fed maintains that recent inflation will prove “transitory.” Others suggest the trillions of dollars in relief and stimulus will continue to inflate not just asset prices but also the cost of meat, gasoline, sugar, clothes and the countless other goods and services that ordinary people use in their everyday lives.
A Century of Rainbows
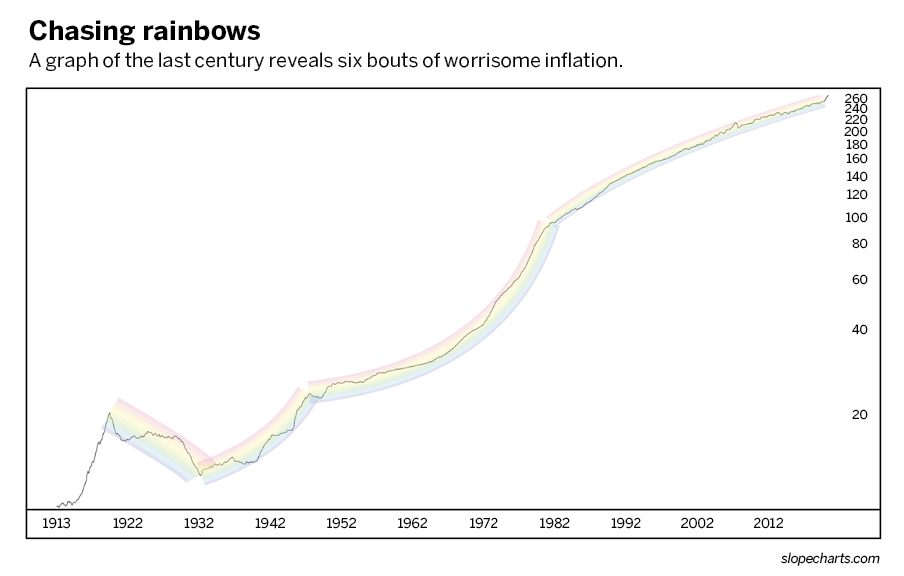
Does it seem like everything costs twice as much as it should? Well, prices have actually climbed a lot more than that in the last 100 years. In fact, they’ve risen an average of 3.12% annually since 1913 for a total increase of 2,670.8%.
Charting that price explosion yields rainbow patterns. That imagery may seem fanciful, but it reflects the smooth curves of long spans of time and emphasizes the particularly strong or weak extremes within those curves of broad overall movement.
Readers can view the long chart included here as representing six distinct eras of inflation.
⊲ 1913-1918: The consumer price index went nearly vertical in 1913 when the Federal Reserve Bank was established and U.S. spending on World War I kicked into high gear. Before then, no one gave a thought to inflation. Generally speaking, prices in 1910 were about the same as in 1870—or 1830. But with the creation of the Federal Reserve, the money supply ballooned and buying power plummeted.
⊲ 1919-1932: Relatively undamaged by the ravages of World War I, the United States became an industrial powerhouse and the breadbasket of the world. Technology brought efficiency and productivity, helping America produce cars, radios and agricultural products at a dizzying pace. That sent prices lower for everyday purchases, particularly food. As pleasant as that sounds, it was devastating for American farmers, who felt the pain of the Great Depression long before it registered with the general public.
⊲ 1933-1945: One of Franklin Delano Roosevelt’s first acts as president was to ban gold and untie its value to the dollar. That released the inflationary genie from the bottle. Without gold as a balance, there was no theoretical cap on how many dollars the Fed could print. It made as much sense as walking out to the driveway in the morning to see if the car was 10% larger. Coupled with substantial government stimulus and the industrial juggernaut of World War II, inflation pushed higher.
⊲ 1946-1968: This was the most prosperous and profitable era in American history. The economy grew persistently, thanks to efficiency and innovation. Although inflation was a yearly reality, it was always a little behind the ever-expanding prosperity of the general public.
⊲ 1968-1982: Inflation’s steady pace hit an inflection point late in the 1960s, and by the mid-1970s it was often the top story on the evening news. President Richard Nixon took radical steps, such as federally mandated wage and price controls, but they were as ineffective as President Gerald Ford’s “WIN” buttons, which stood for Whip Inflation Now. Inflation ran rampant until the Fed finally halted it by ratcheting interest rates up to a heart-stopping 20%.
⊲ 1983-present: Once red-hot inflation has been snuffed out, the growth of the U.S. Consumer Price Index returned to a pace that would have been familiar to consumers of the 1950s and 1960s—steady but not devastating to household budgets. This era may already have ended, but it will be years before that’s entirely clear.
Tim Knight has been using technical analysis to trade the markets for 30 years. He’s the host of Trading the Close on the tastytrade network and offers free access to his charting platform at slopecharts.com. @slopeofhope