Bond Markets at the Brink
Treasuries may be at a make-or-break moment
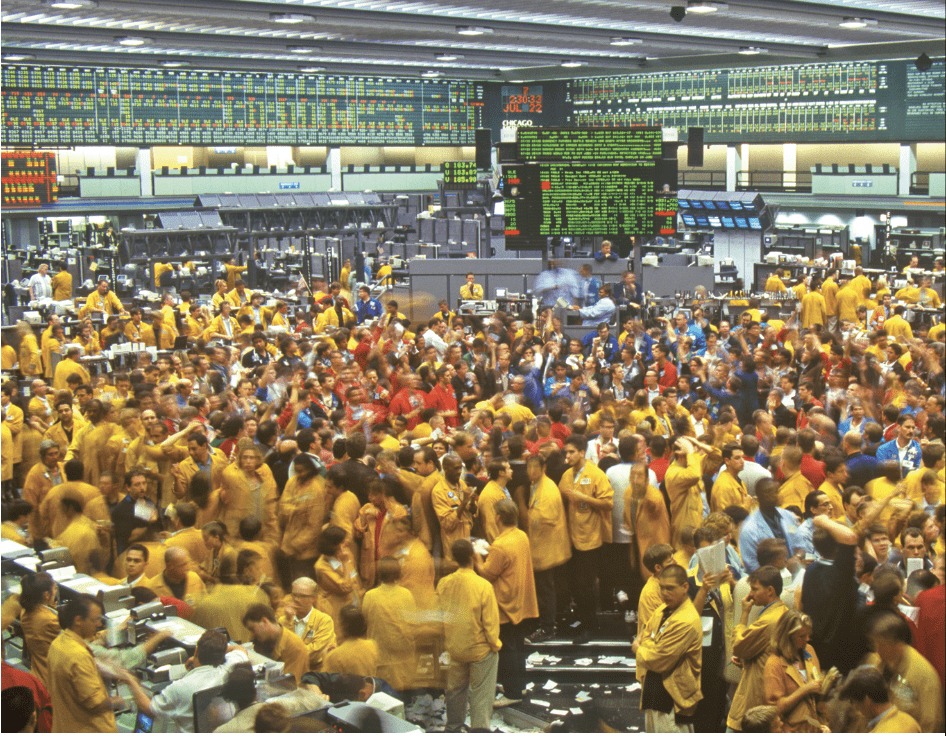
This year started off well enough. The bulls ran free in the markets as fear receded that the Federal Reserve would continue to hike interest rates to combat inflation. The Nasdaq 100 futures contract (/NQ) posted its best January since 1999.
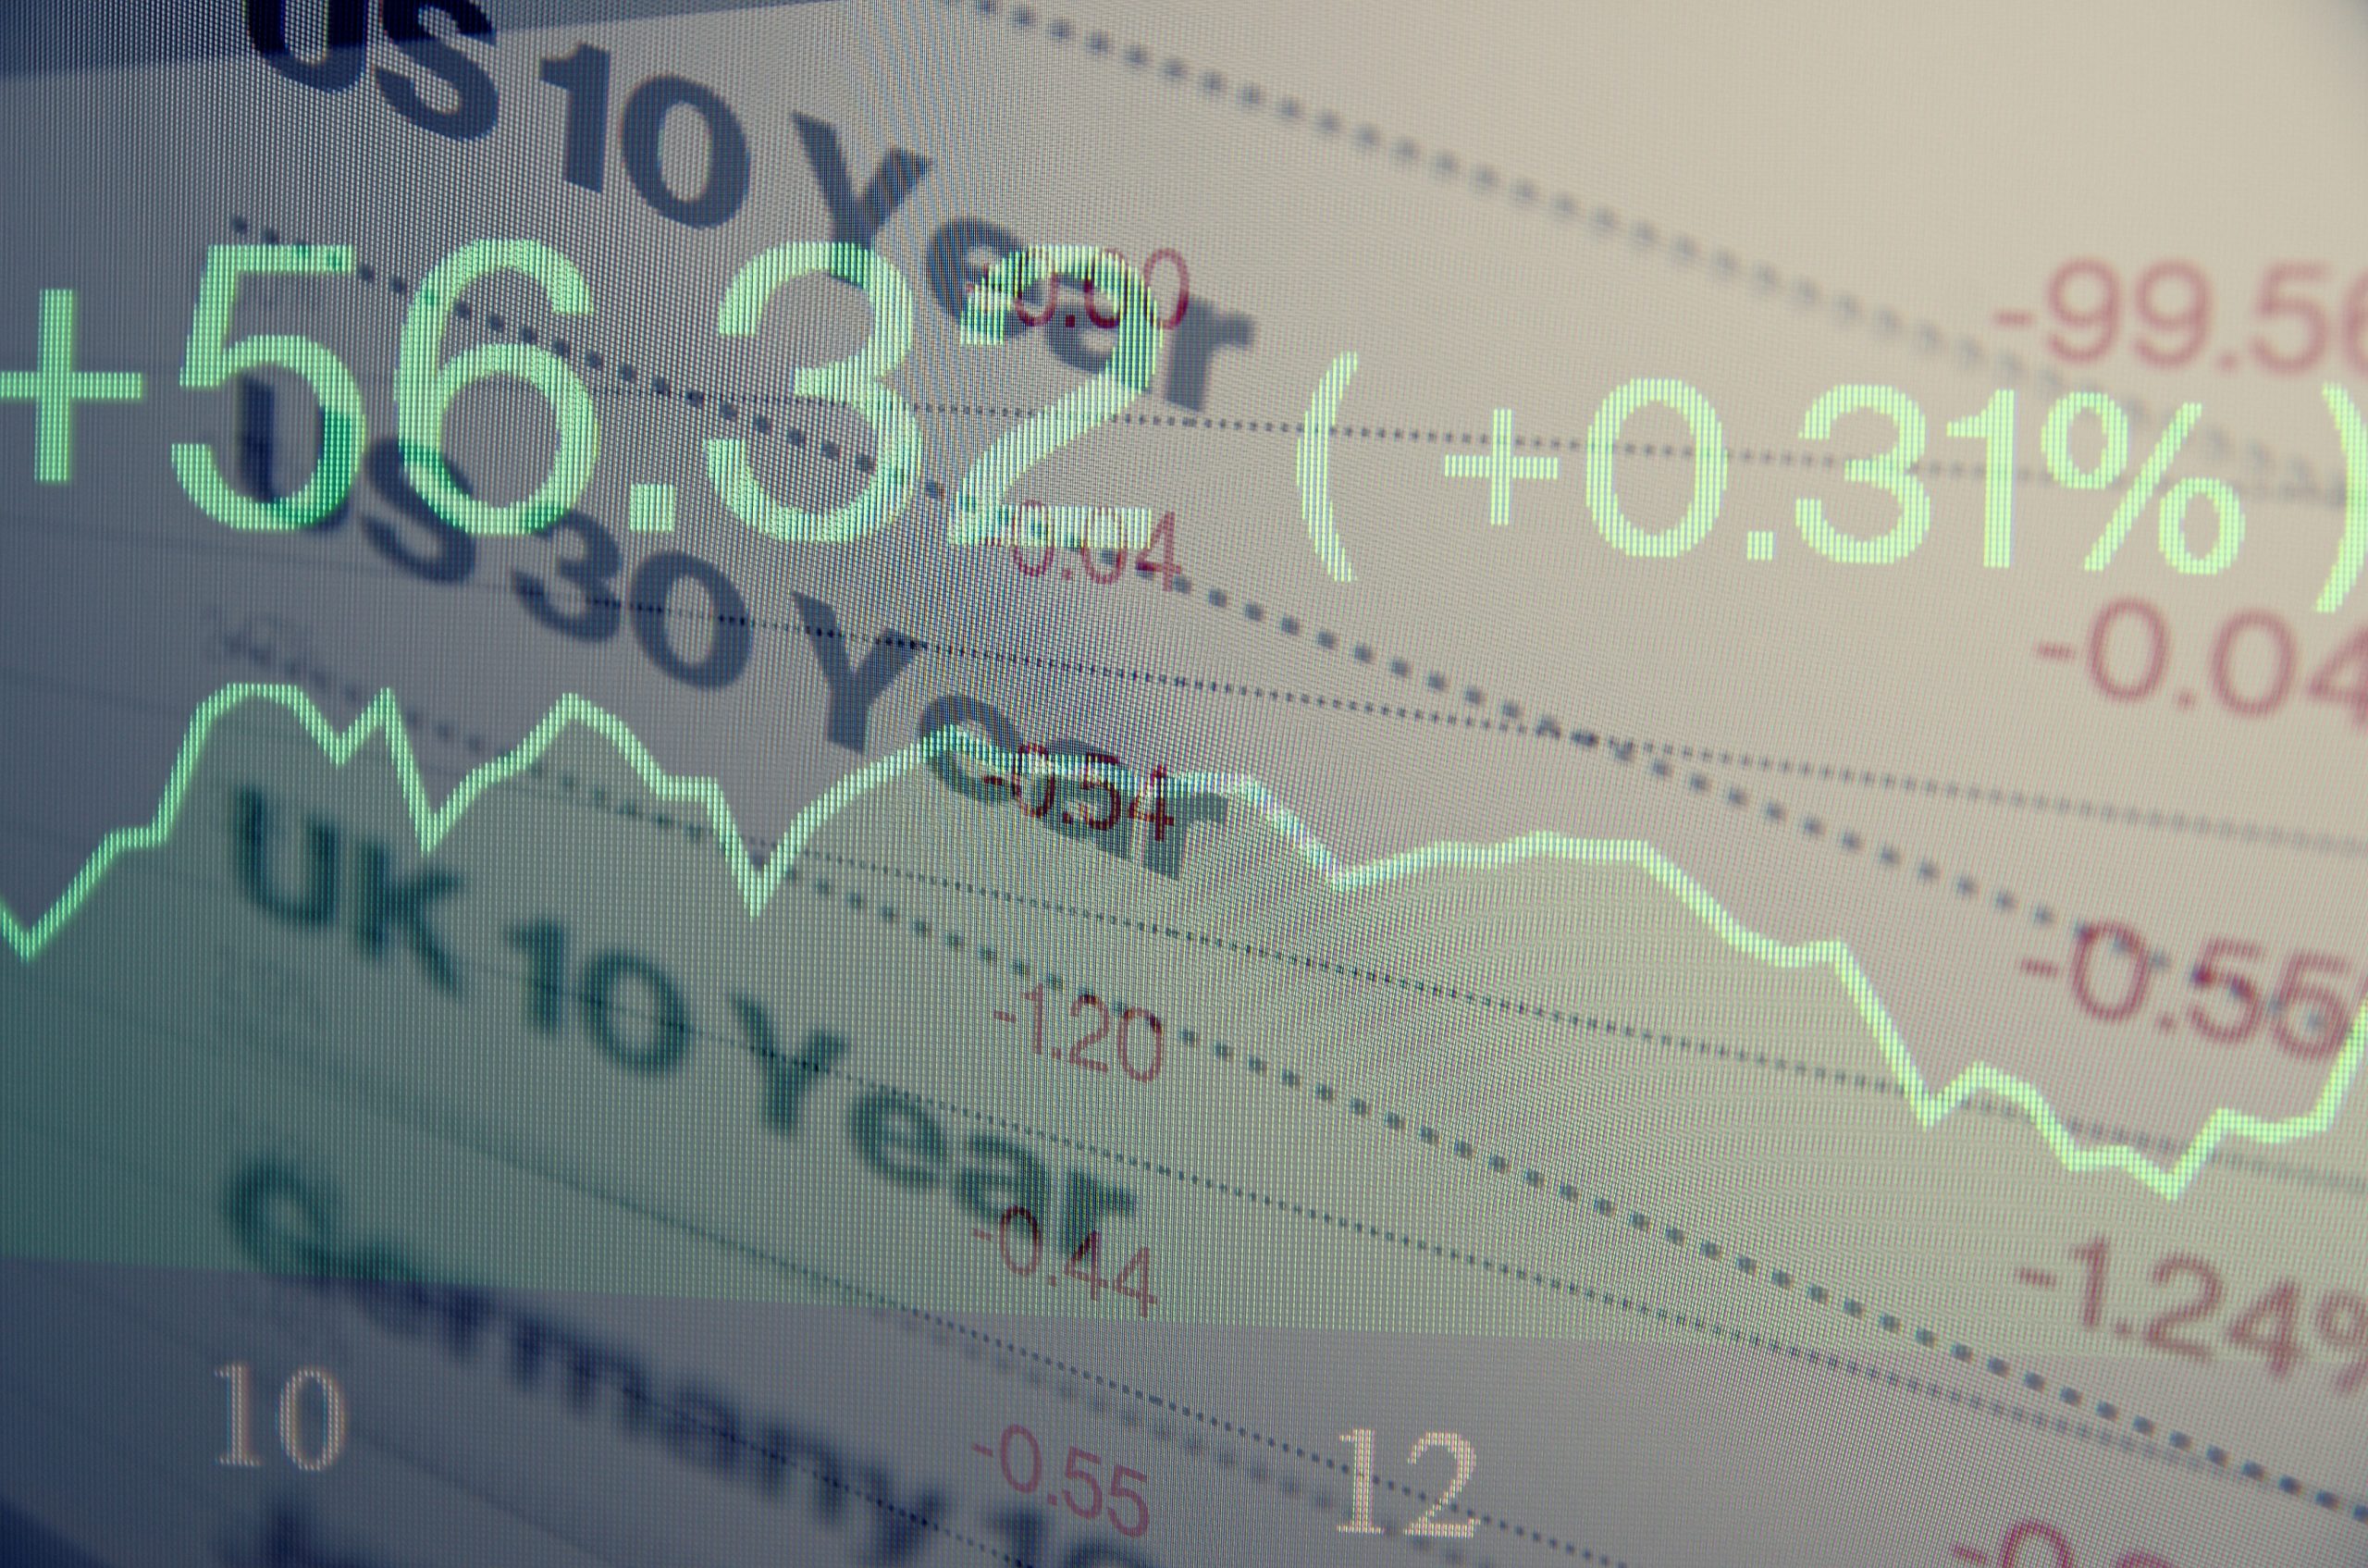
But it wasn’t happening just in the equity markets; bond bulls were running wild, too. Treasury yields were down across the curve as bond prices rallied. The 30-year note gained 7’14 in January, an increase of 5.54%.
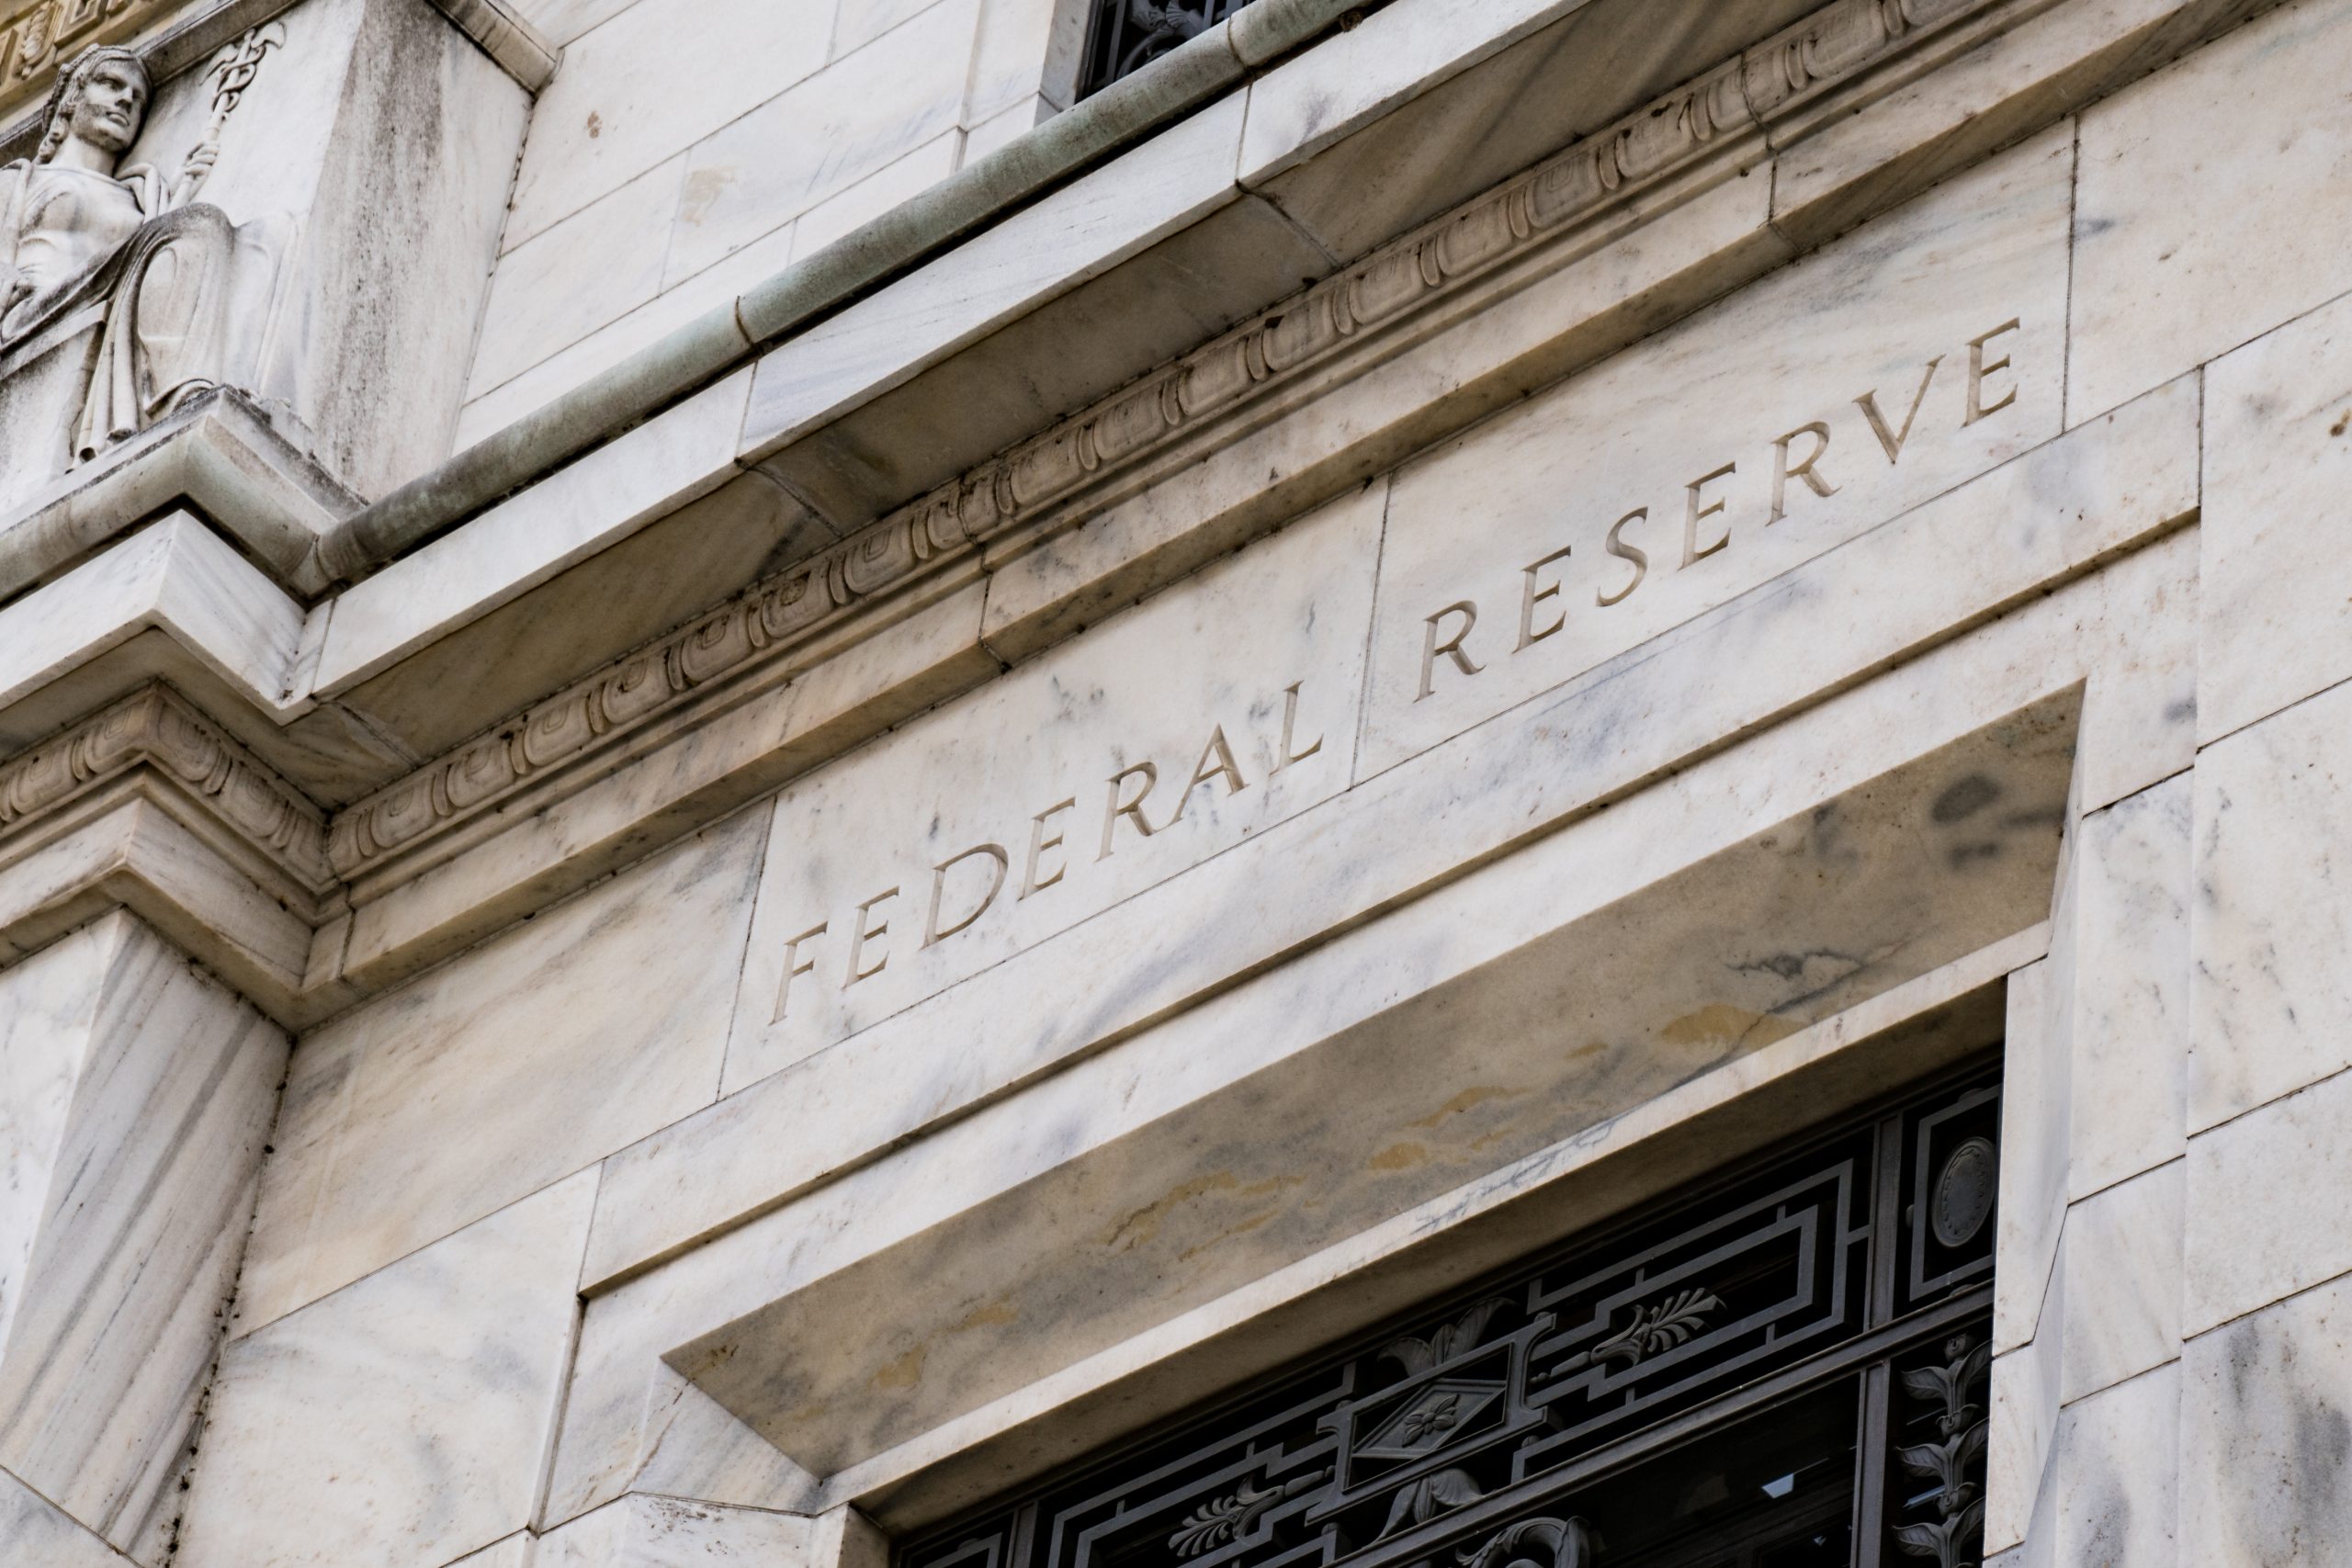
But now much has changed. In January, average hourly earnings for non-farm employees in the private sectorrose by a significant 10 cents. Couple that with the release of a hot January consumer price index, and the result showcases the economy’s resiliency. Then, the Federal Reserve’s February meeting provided the most recent rationale for bullishness in 2023.
After all, the labor market remains strong, and as a result, demand hasn’t been reduced enough thus far to bring down inflation. But the macroeconomic narrative has shifted as the facts on the ground—or at least the perception of those facts—has changed.
Coming into 2023, most market participants believed the economy was going to fall into recession, thus providing the excuse the Fed would need to stop raising rates. Yet that hasn’t happened: The data from January points to an economy still experiencing 2% seasonally adjusted growth in the gross domestic product. If the economy is still chugging along, then the Fed has more slack to fight inflation. At least that’s how the thinking goes.
The knock-on effect for both bonds and stocks was brutal as markets reassessed their assumptions around where the Fed’s main interest rate will end up this year.
At the start of February, Fed funds futures were discounting the main rate to peak at 4.88% in July 2023. Now, more than halfway through February, they were discounting the main rate to peak at 5.4% in August 2023.
The market’s interpretation of recent data and Fedspeak has been clear: interest rates are going higher, for longer. And the window for the Fed to cut interest rates in 2023 is closing quickly.
The market’s interpretation of recent data and Fedspeak has been clear: interest rates are going higher, for longer.
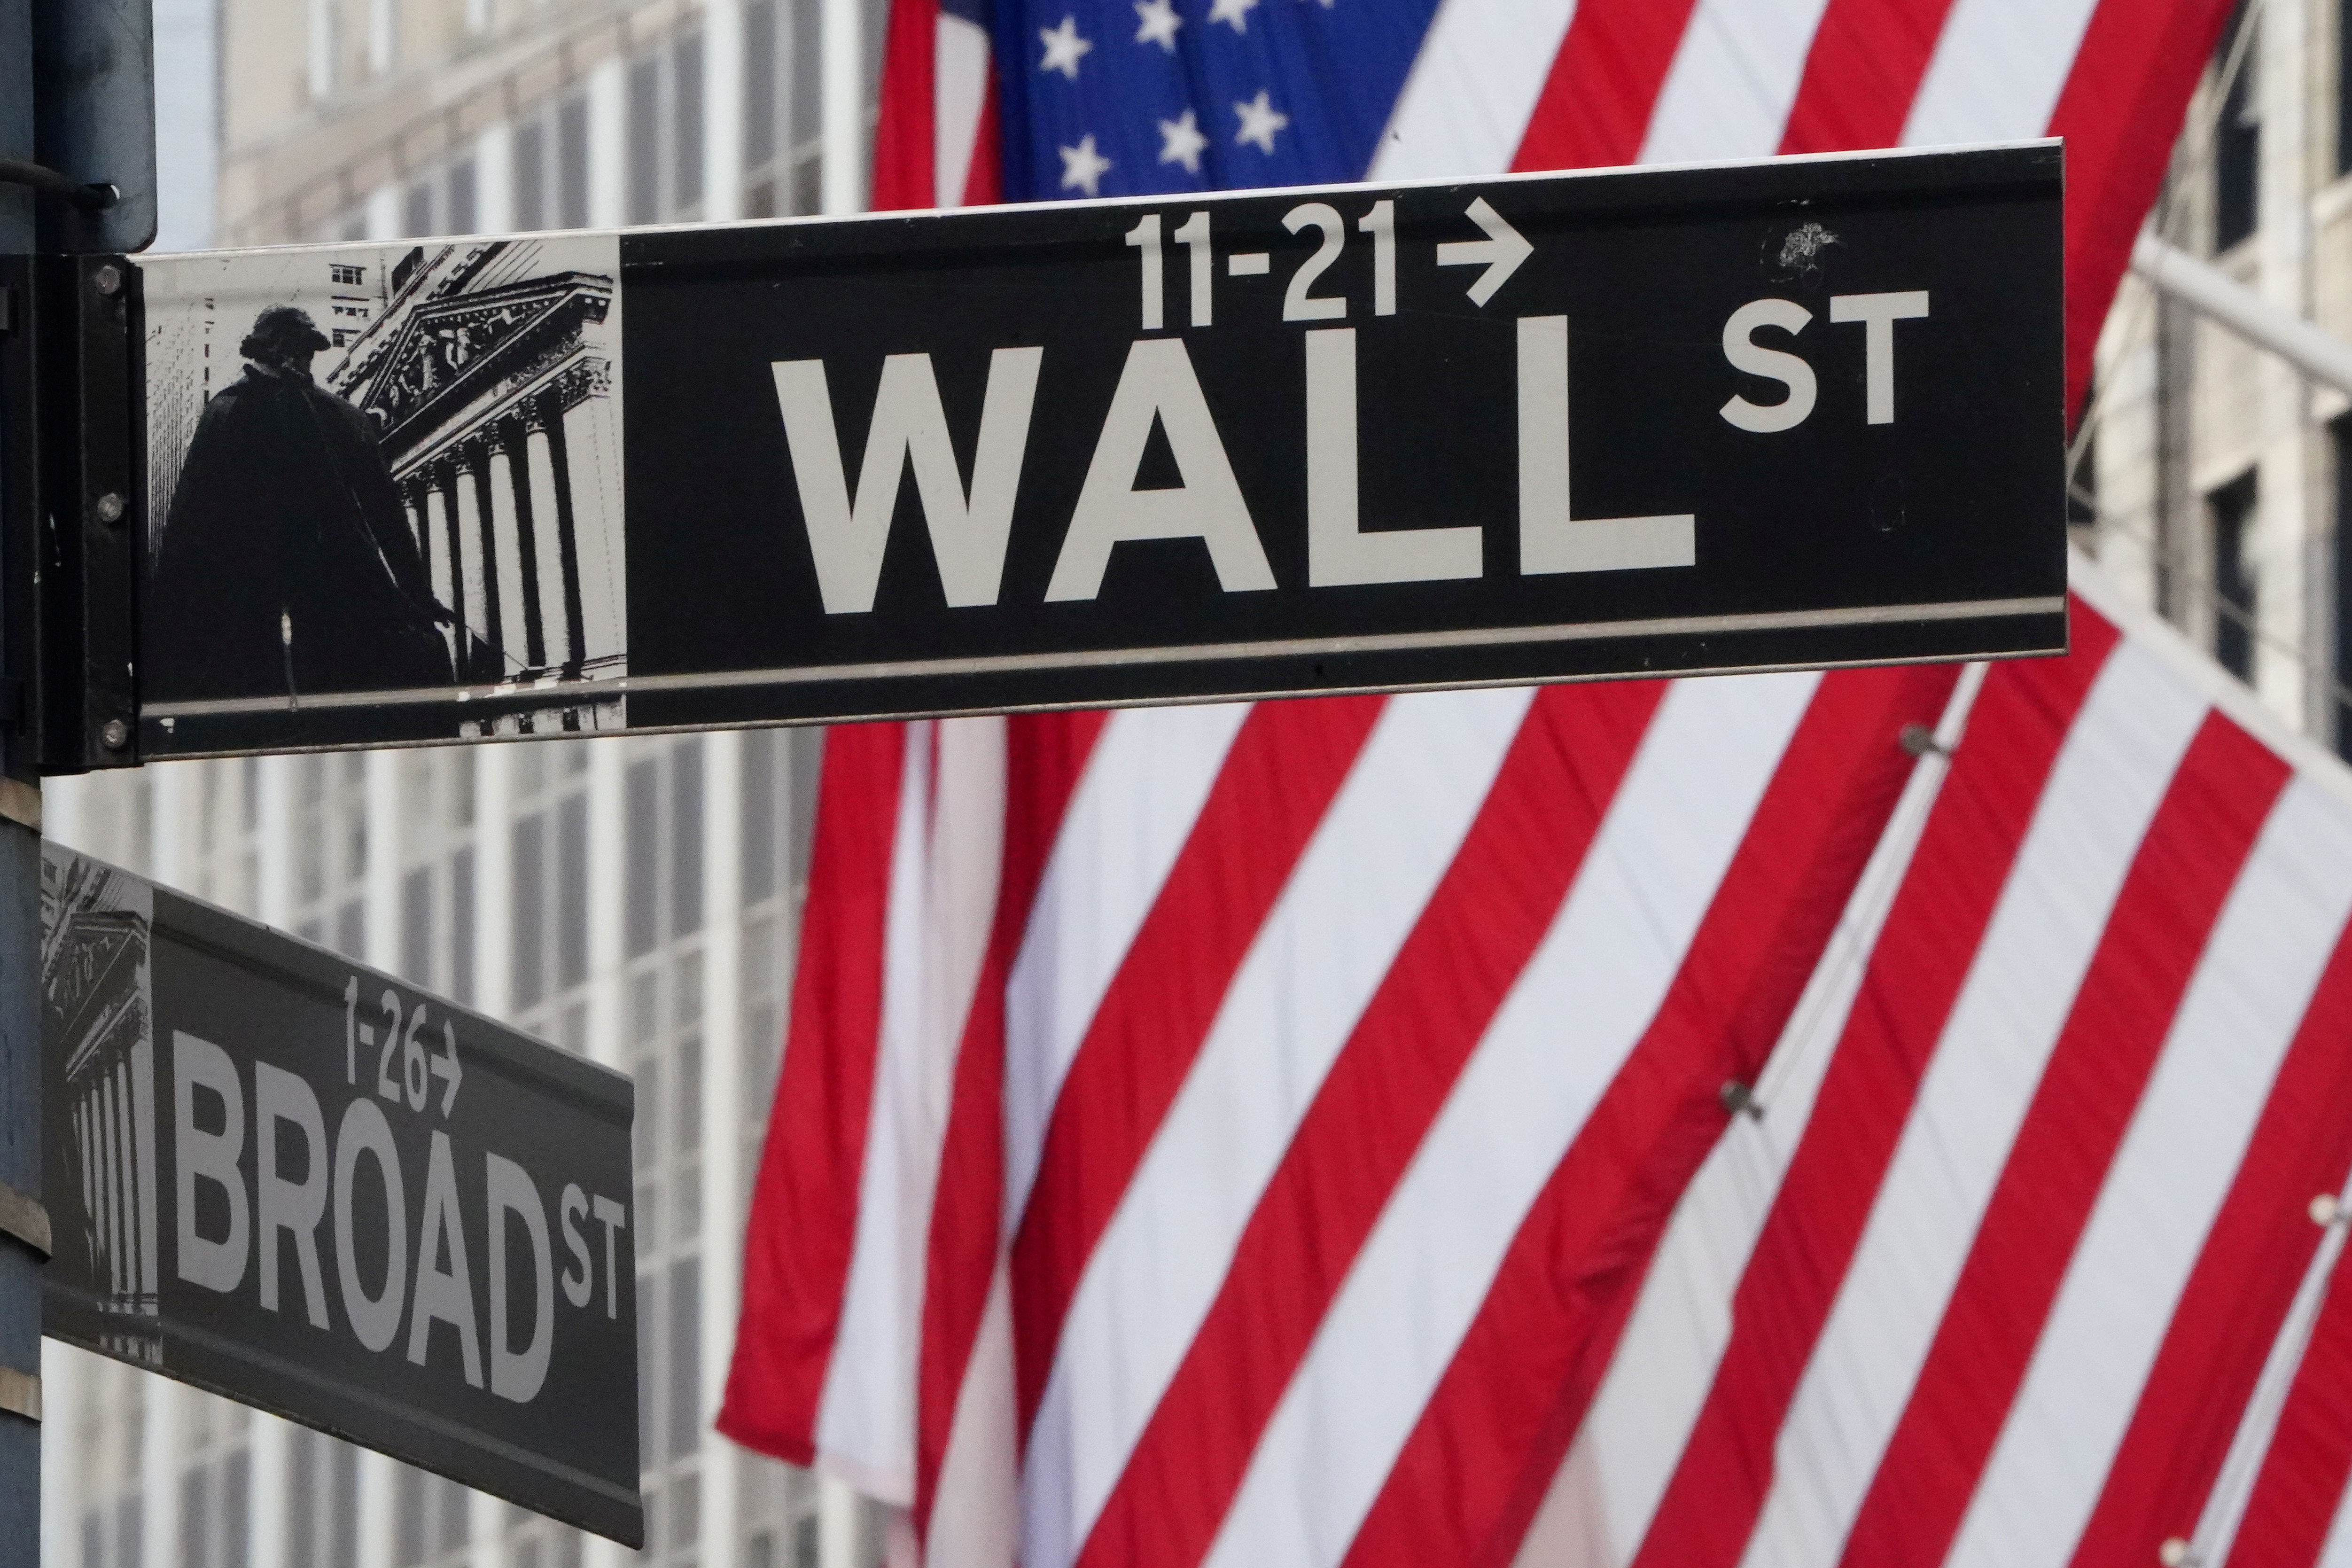
It may seem paradoxical that the appetite for risk has been diminished as the economy appears to be withstanding the impact of higher interest rates. But the disconnect between Wall Street and Main Street underscores market participants’ fixation with liquidity conditions above all else.
What was given in January was taken back (and then some) in February, at least in bond markets. Bond prices were down across the curve as yields jumped. The two-year note lost 1’06’6 in the first three weeks of February, a drop of 1.17%. The 10-year note gave back 3’23’5, a loss of 3.26%. The 30-year note fell by 6’30 thus far, falling 4.89%.
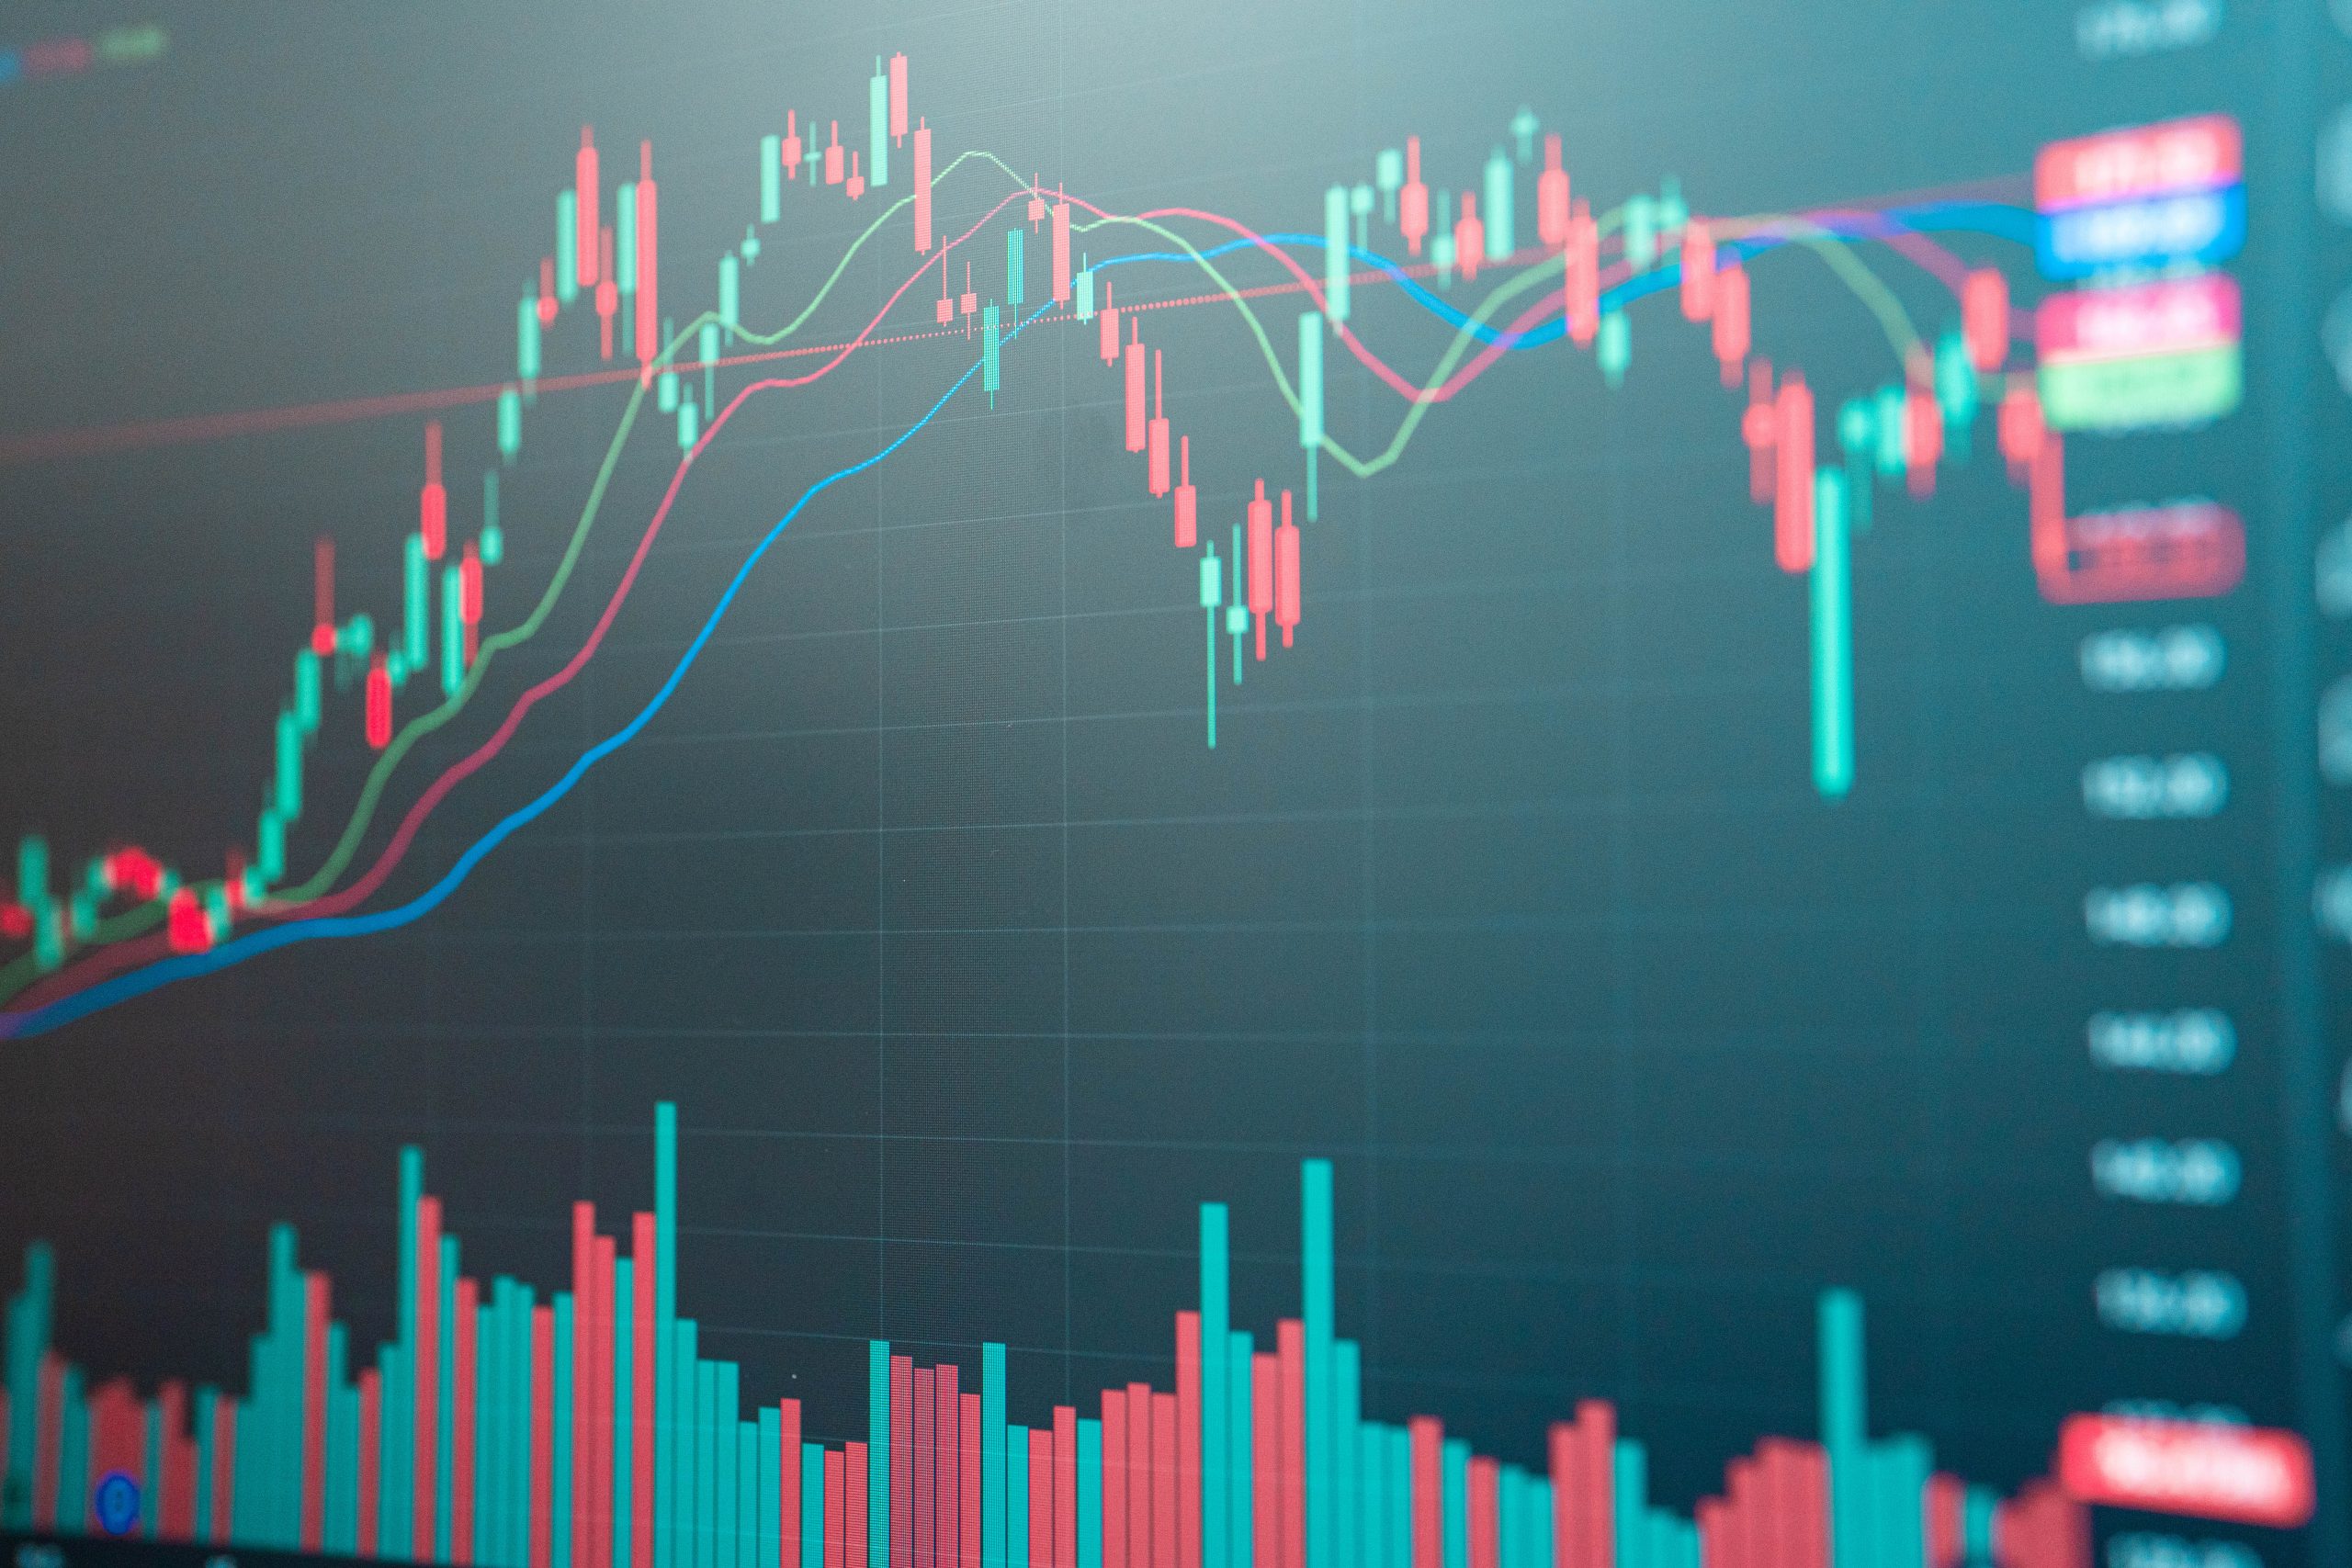
As we entered the final stretch of Q1 2023, the deleterious price action in February had bond markets sitting at the brink. Two-year Note futures have quickly returned to their lows from 2022, suggesting a breakout to a new high is potentially around the corner. Meanwhile, 10-year Note futures have recently broken their December 2022 lows, setting the 10-year yield on a path to return to its high of 2022 as well.
But perhaps traders’ attention should be on something like Treasury bond futures (/ZB). These futures differ from Ultra-bond futures (/UB) insofar as the Treasury bond futures are composed of bonds with remaining terms to maturity of 17-25 years, while Ultra-bond contracts are composed of bonds with remaining terms to maturity of 25 years or more.
In the second half of February, Treasury bond futures fell toward range support in the area around 124’00. The range, roughly between 124’00 and 132’20, has been in place since mid-November 2022.
When compiling this piece, with an implied volatility index sitting below 14.5%, the IV rank of Treasury bond futures was holding below 5.0, suggesting that current implied volatility was lower than 95% or more of daily occurrences over the past year.
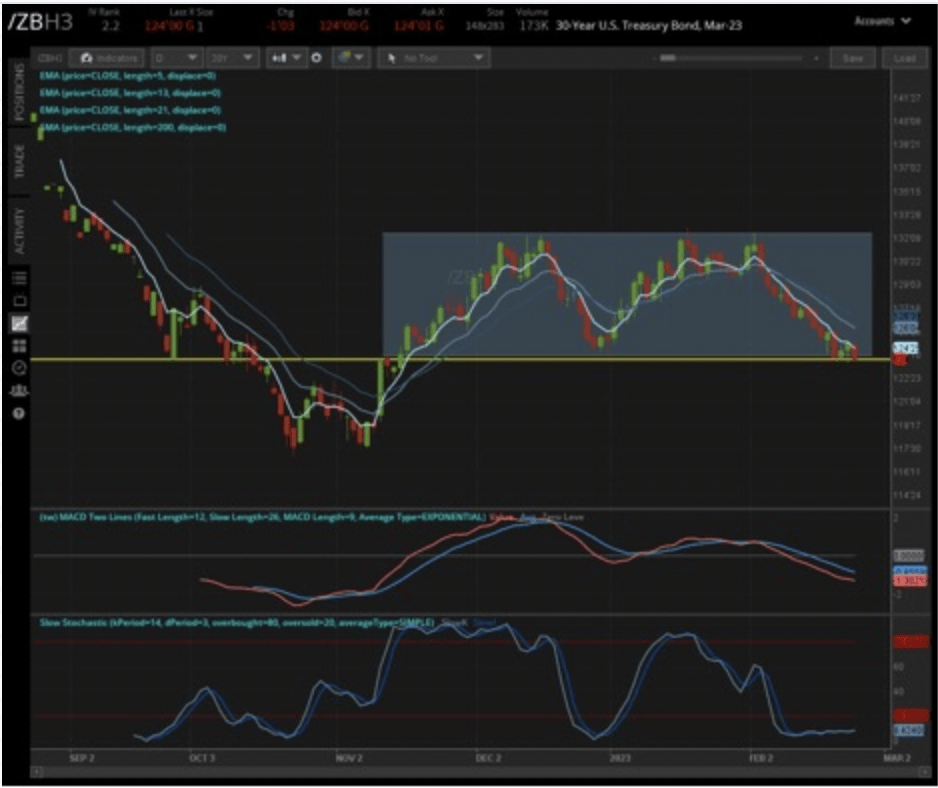
We’ve arrived at a technically significant zone of support while volatility has been crushed. It’s not exactly a friendly mix of conditions for traders who might try to call a bottom—the range holding—by selling puts.
Selling puts alone could be nasty for two reasons. First, any premium that could be collected is relatively low, leaving one exposed to volatility expanding against their position. Second, a bearish directional breakout is absolutely a possibility.
For example, selling the /ZBM3 (June ’23) 124’00 put would allow you to collect approximately $1,290, but the max loss is potentially over $122,000.
Instead, if you’re a believer in the 124’00/132’20 range holding, the more risk-defined strategy could be to create an iron condor.
An iron condor is a neutral options strategy that combines bullish and bearish vertical spreads—long one call, long one put, short one call, short one put, all with different strikes but the same expiry.
Buying the /ZBM3 120’00 put, selling the 122’00 put, selling the 128’00 call, and buying the 130’00 call would enable investors to collect $1,188, but the max loss would be capped at -$813.
Bond markets may be at the brink, but traders have ways to take advantage of these conditions in a well-thought, risk-defined manner—regardless of shifting macroeconomic narratives around the perception of Federal Reserve monetary policy.
Christopher Vecchio, CFA, head of futures and forex at tastylive, forecasts economic trends in a number of countries. @cvecchiofx