Let’s Be Precise About Accuracy
They’re not the same, and knowing the difference could lead to successful investing
Accuracy versus precision. Some might think they mean the same thing, but their differences are apparent in many outdoor activities and might lead to profitable trades.
Examples of accuracy include a golfer sinking a putt, a pitcher grazing the strike zone and a hunter stopping a feral Texas hog dead in its tracks. Sometimes, the word “precision” is used to describe that type of action, and it muscles “accuracy” out of its rightful definition. But precision is different, and archery shows the relationship between the two words.
Take the most famous archer, William Tell, for example. There would be no legend of William Tell if he had missed. If he missed a little high, he’d be a forgotten victim of medieval Swiss tyranny. If he missed a little low, he’d be charged with murder. What Tell needed was accuracy to hit the apple on his son’s head with one shot. Now, if the evil magistrate thought one time could be luck and that Tell would have to shoot a second apple to save his and his son’s lives, what Tell would need is precision.
If someone shoots five arrows and they all hit the bullseye very close to each other, the archer is both accurate and precise. If the five arrows land around the bullseye but are farther apart, the archer is accurate but not precise. And if the five arrows all hit the target far off to the side but are close together, the archer isn’t accurate but precise.
In other words, accuracy is how close something comes to a target. Precision is how repeatable that accuracy is. In some sports, one instance of accuracy is enough. But in others, where success is determined by repeated instances of accuracy, precision is required.

Using archery again as an example, accuracy is measured by how close an arrow lands in relation to the center of the bullseye. It might hit the bullseye in the absolute center and thus have zero deviation. Another arrow might hit the edge of a bullseye, and the distance between where it hits and the center of the bullseye can be measured. Precision considers the distances between where all the arrows land and the center of the bullseye to calculate the standard deviation of the distances. Low standard deviation means high precision, and vice versa.
With sports, it’s best to have high accuracy and high precision. But in trading, precision might take precedence over accuracy. Here’s why.
Selling naked short puts in a variety of individual stocks and indexes, it’s possible to see both accuracy and precision in action. Shorting puts is a bullish strategy, and some investors scan the deltas of a stock’s puts to find one to sell. Delta is a proxy for the probability that an option will be in-the-money (ITM) at expiration. One minus the option’s delta is an estimate of the probability that the option will be out-of-the-money (OTM) at expiration.
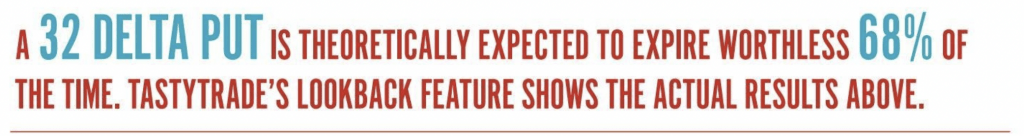
So, a put that has a 32 delta should expire worthless about 68% of the time.
Using tastytrade’s lookback tool (lookback.tastytrade.com) with a max of 17 years of data to backtest short put strategies in five popular stocks, with each put having a 32 delta (68% probability of expiring worthless) and 50 days to expiration (DTE), these are the results. The short put in IBM (IBM) expired worthless 81% of the time. The short put in Apple (AAPL) expired worthless 85% of the time. The short put in Tesla (TSLA) expired worthless 84% of the time. The short put in Disney (DIS) expired worthless 84% of the time. And the short put in the S&P Index (SPX) expired worthless 88% of the time.
See a pattern? Each of those puts had a 68% theoretical probability of expiring worthless, but historically, they expired worthless an average of 84.4% of the time, with a 2.5% standard deviation. That they expired worthless more frequently means that the delta isn’t the most accurate estimate of how often the put might expire worthless. But the results are fairly precise, all around that 84.4% average. Why is that?
One of the main factors used to calculate delta is the implied volatility of the option. Implied volatility is based on the option’s market price, which is determined by the buying and selling pressures of all the people trading that option. For stocks and stock indexes, there is usually a strong opinion that they might drop faster than they can rise, and people are buying puts both as a hedge against long stock and as speculation that the stock might fall.
That means OTM put prices are elevated, which translates into a higher implied volatility, which in turn increases the put’s delta. If the delta is higher, the probability of expiring worthless is lower. The results of the test indicate that the market is overstating how much the stock might drop. In other words, the market thinks that puts in those five symbols will be ITM about 32% of the time, but historically they’ve only been ITM about 16% of the time. Delta isn’t necessarily accurate, but the results are very precise. That’s why shorting options can be profitable over time.
So, this summer, maybe skip playing William Tell. Try shorting high probability options instead.
Tom Preston, Luckbox contributing editor, is the purveyor of all things probability-based and the poster boy for a standard normal deviate. @thetompreston