Having a Meltdown Over Nuclear Energy?
Fortunately, there’s a formula for that. Let Poisson help you decide.
Humans function like pattern-recognition machines, and that’s generally a helpful trait. For example, they learn early on that cheeseburgers are delicious and don’t kill them, so they save time by zeroing in on cheeseburgers when they’re hungry. There’s a high probability that the cheeseburger will taste a certain way and fill them up, and most of the time—if not all—that’s true.
But sometimes the pattern-recognition part of the brain gets hijacked when it perceives a pattern based on a very small number of occurrences, especially when what occurs is dramatic. Like a nuclear meltdown.
Readers of a certain age might remember Three Mile Island back in 1979. Chernobyl in 1986. Tokaimura in 1999. Fukushima in 2011. Each received a lot of media attention, and people envisioned mushroom clouds over their local nuclear power plants. Scary stuff. That slowed or even stopped nuclear power plant construction, at least in the United States.
But nuclear power is re-entering the national discussion as citizens worry about energy security, the environment, and the cost of heating homes and fueling cars. Yes, it creates nuclear waste. And there’s the possibility of a meltdown, where the plant’s coolant fails and the radioactive fuel rods get so hot they break through the protective layers encasing them and spew radioactivity into the atmosphere. Not quite mushroom clouds, but bad.
In return for the bad stuff of nuclear reactors, consumers get efficient, reliable power that frees them from the vagaries of sun, wind, water levels, coal and natural gas. Whether that’s a good trade or not depends on the probability of that bad stuff happening.
And there’s a way to calculate it.
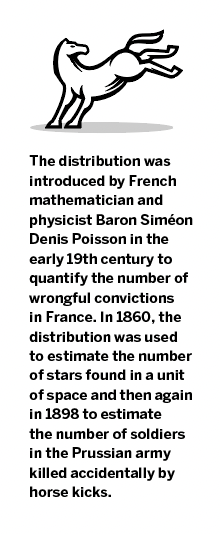
The Poisson distribution (named after a 19th century French math genius, not a fish) is used to calculate the probability of events occurring in a specific amount of time. Its variety of business applications includes estimating numbers of bankruptcies per month, numbers of website visitors per hour, numbers of restaurant visitors per day, numbers of emergency calls received at any given minute—the list goes on.
The data is discrete, like the number of customers who will walk into a bank in the next hour. Or nuclear meltdowns. Just as there’s no way 10.5 customers can walk through the doors in the next hour, there isn’t such a thing as 1.5 meltdowns. The Poisson distribution calculates the probability only of whole numbers.
The Poisson distribution assumes the events are independent of each other. That is, one event happening does not affect the probability that a subsequent event will occur. It also assumes that the rate of the number of events over time is constant. Here’s the basic formula:
P(x) = (lx * e-l)/x!
The Poisson distribution requires only two inputs: “l,” the expected or average number of occurrences (which can be a fractional number), and “x” the number of occurrences for which the probability is calculated. For example, if the average number of bank customers in an hour is determined to be 8.3 (that’s “l”), the Poisson distribution can tell you the probability that there might be 10 (that’s “x”). Plug 8.3 and 10 into that formula and the probability of getting 10 bank customers in the next hour is 10.6%. With a bit more work, or using Microsoft Excel’s POISSON cumulative probability function, there’s a 32% probability that there will be 10 or more bank customers in the next hour. Here’s how it can be used to estimate the probability of a nuclear meltdown.
There are about 440 nuclear reactors worldwide. Given the relatively small number of meltdowns or catastrophic events, people look at the rate per “reactor year,” which is simply the number of years a reactor operates before there’s a meltdown. Estimates might range from one failure in 3,000 years to one in 10,000 years. The probability of a catastrophe in one year is very low, so probabilities are often given in terms of 10 years. Using a rate of one meltdown per 3,000 reactor years for 440 reactors, the formula would be 1/3,000 x 440 x 10 years = 1.47. The probability of one or more meltdowns in 10 years is about 77%.
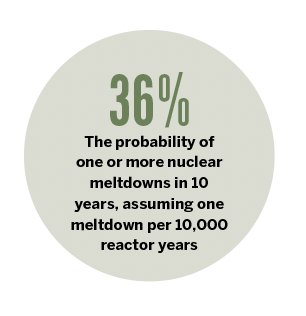
Now, using a rate of one meltdown per 10,000 reactor years, the formula would be 1/10,000 x 440 x 10 years = 0.44. The probability of one or more meltdowns in 10 years is about 36%. This is where some of the controversies over nuclear power come in. Change the number of meltdowns in reactor years, and the probability can change dramatically. But without a probability, any assessment of the risk is just guessing.
Scientists who do battle over the safety of nuclear power may use somewhat more complex models, but the Poisson distribution is at the heart. Before you write off nuclear power as too dangerous, keep your pattern recognition in check.
Weigh the risks in terms of probability, and see if they’re outweighed by the benefits.
Tom Preston, Luckbox contributing editor, is the purveyor of all things probability-based and the poster boy for a standard normal deviate. @fittypercent