Short Puts in Small Stocks
Low-priced stocks and short put strategies are essential ingredients for active investors, but challenges arrive when mixing them
A contrarian options trader might see a bullish opportunity when a stock gets pummeled to a low price. It’s a Pavlovian reaction, but there’s nothing wrong with that. There’s money to be made by taking on risk.
When an increase in implied volatility accompanies the sell-off in a stock, a trader speculating on a bullish bounce might use a short put. Because a short out-of-the-money (OTM) put has a lot going for it as a bullish strategy—higher credit, high probability of profit and positive theta. But when a stock’s price gets too low, a trader looking to short a put might run into a battle between percents and points.
Put simply, if a $100 stock moves up $1, that’s 1 point and also 1%. If a $10 stock moves up $1, that’s 1 point but 10%. A $1 change is the same amount no matter what the stock’s price, but it can represent a different percentage change.
That’s important because while people trade and invest to make dollars to spend or save, options’ theoretical values are derived from percents. To explain, let’s take a little statistical detour.
An OTM option is valued by how far its strike price is from the current stock price along the normal distribution curve, then deriving a probability of the stock price reaching the strike price from the normal distribution. The farther the strike price is from the stock price—all other things being equal (i.e., time to expiration and volatility)—the lower the probability that the stock will drop (in the case of an OTM put) to the option’s strike price, and the lower the option’s value.
But the normal distribution doesn’t use the stock price and strike price themselves. It converts them to percents. The current stock price has a 0% difference from itself, so it sits at the peak of the normal distribution curve at the mean. The strike price of a short OTM put is some percent away from the current stock price, and it sits somewhere to the left of the peak. For example, the 95 strike is 5% lower than a $100 stock price. The way an options pricing model looks at it, the $100 stock price sits at 0%, and the strike price sits at about -5%.
Now, here’s the problem with low-priced stocks. The exchanges where options are traded determine their strike prices, as well as the minimum difference between adjacent strikes. The exchange considers the price of the stock as well as the expected interest in trading options at a particular strike when adding new strikes to an expiration.
For example, a $1,000 stock like Tesla (TSLA) has a minimum of 5 points between strike prices, e.g., 945 to 950. A $200 stock like Netflix (NFLX) has a minimum of 2.5 points between strikes. SPY (the S&P 500 Exchange-Traded Fund) has 1 point between strikes. The difference is point-based, not percent-based.
When a stock price drops, the number of points that a strike price is away from the current stock price becomes a larger percent. The larger percent translates into a lower probability the stock will reach that strike, and in turn, makes an option at that strike price cheaper.
For the “Greeks” geeks, how much a change in the percent difference between the strike price and the stock price impacts the option price is known as an option’s elasticity.
There’s a formula for it, but it’s not widely used because trading is done in points, not percents. But the impact of elasticity combined with low stock prices is that they can reduce the flexibility that options provide, as well as the actual dollar amount of profit a contrarian trader can make on a short put on a beaten-down stock.
When an increase in implied volatility accompanies the sell-off in a stock, a trader speculating on a bullish bounce might use a short put.
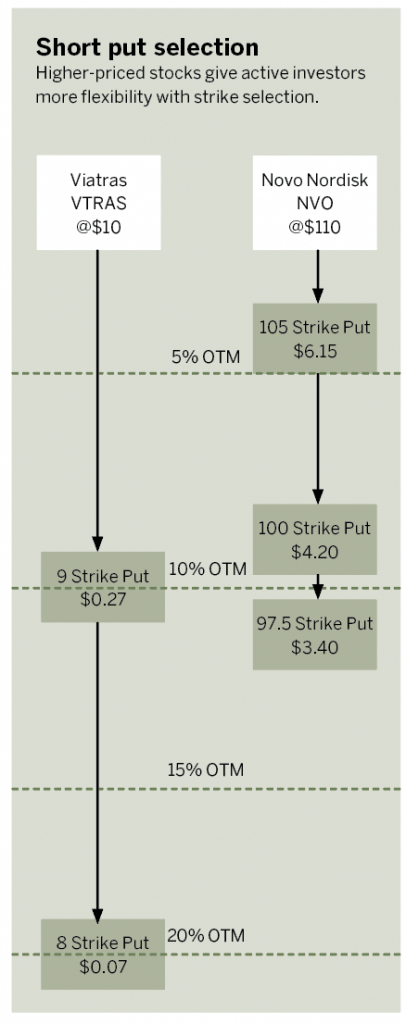
Take two stocks in the pharmaceutical industry: Viatris (VTRS) and Novo Nordisk (NVO). Both have options traded on them and have similar implied volatilities. They’ve had some sharp drops in 2022, and could be appealing to traders for bullish strategies. But Viatris is a $10 stock, and Novo Nordisk is a $110 stock.
Looking at options with 56 days to expiration, the 9 put is the first OTM put strike for Viatris. It’s 10% OTM and valued at $0.27. The next OTM put for Viatris is at the 8 strike. It’s 20% OTM and valued at $0.07. For Novo Nordisk, the first OTM put is at the 105 strike with a 4.5% OTM and valued at $6.15. The next OTM put is the 100 strike with a 9% OTM and valued at $4.20. The last OTM put is the 97.5 strike with a 11% OTM and valued at $3.40.
This shows that the large percentage difference between strikes in low-priced stocks knocks the premiums of the OTM options down quickly. In Viatris, traders don’t have much choice between selling the 9 put and not having much room for the stock to drop, versus selling the 8 put and only collecting $7 of max potential profit. Novo Nordisk’s puts give traders more flexibility in not just selecting which OTM put to sell, but because they have higher premiums, they can potentially be closed for profits sooner. Yes, the linear relationship of option prices to stock prices is a factor in Novo Nordisk’s larger put values, but the elasticity of options is playing a big role, too.
Tom Preston, Luckbox contributing editor, is the purveyor of all things probability-based and the poster boy for a standard normal deviate. @thetompreston