Active Trading Comes of Age
Probability and statistics have supplanted shouting and scalping
The phrase “active trading” might suggest a wild-eyed investor screaming “Buy! Sell! Buy! Sell!” But now that most stock and options trading has moved online, the tension has eased and the pace has slowed.
Along the way, the very meaning of active trading has changed. While it used to denote day trading or scalping, it now applies to investing based on probability and statistics.
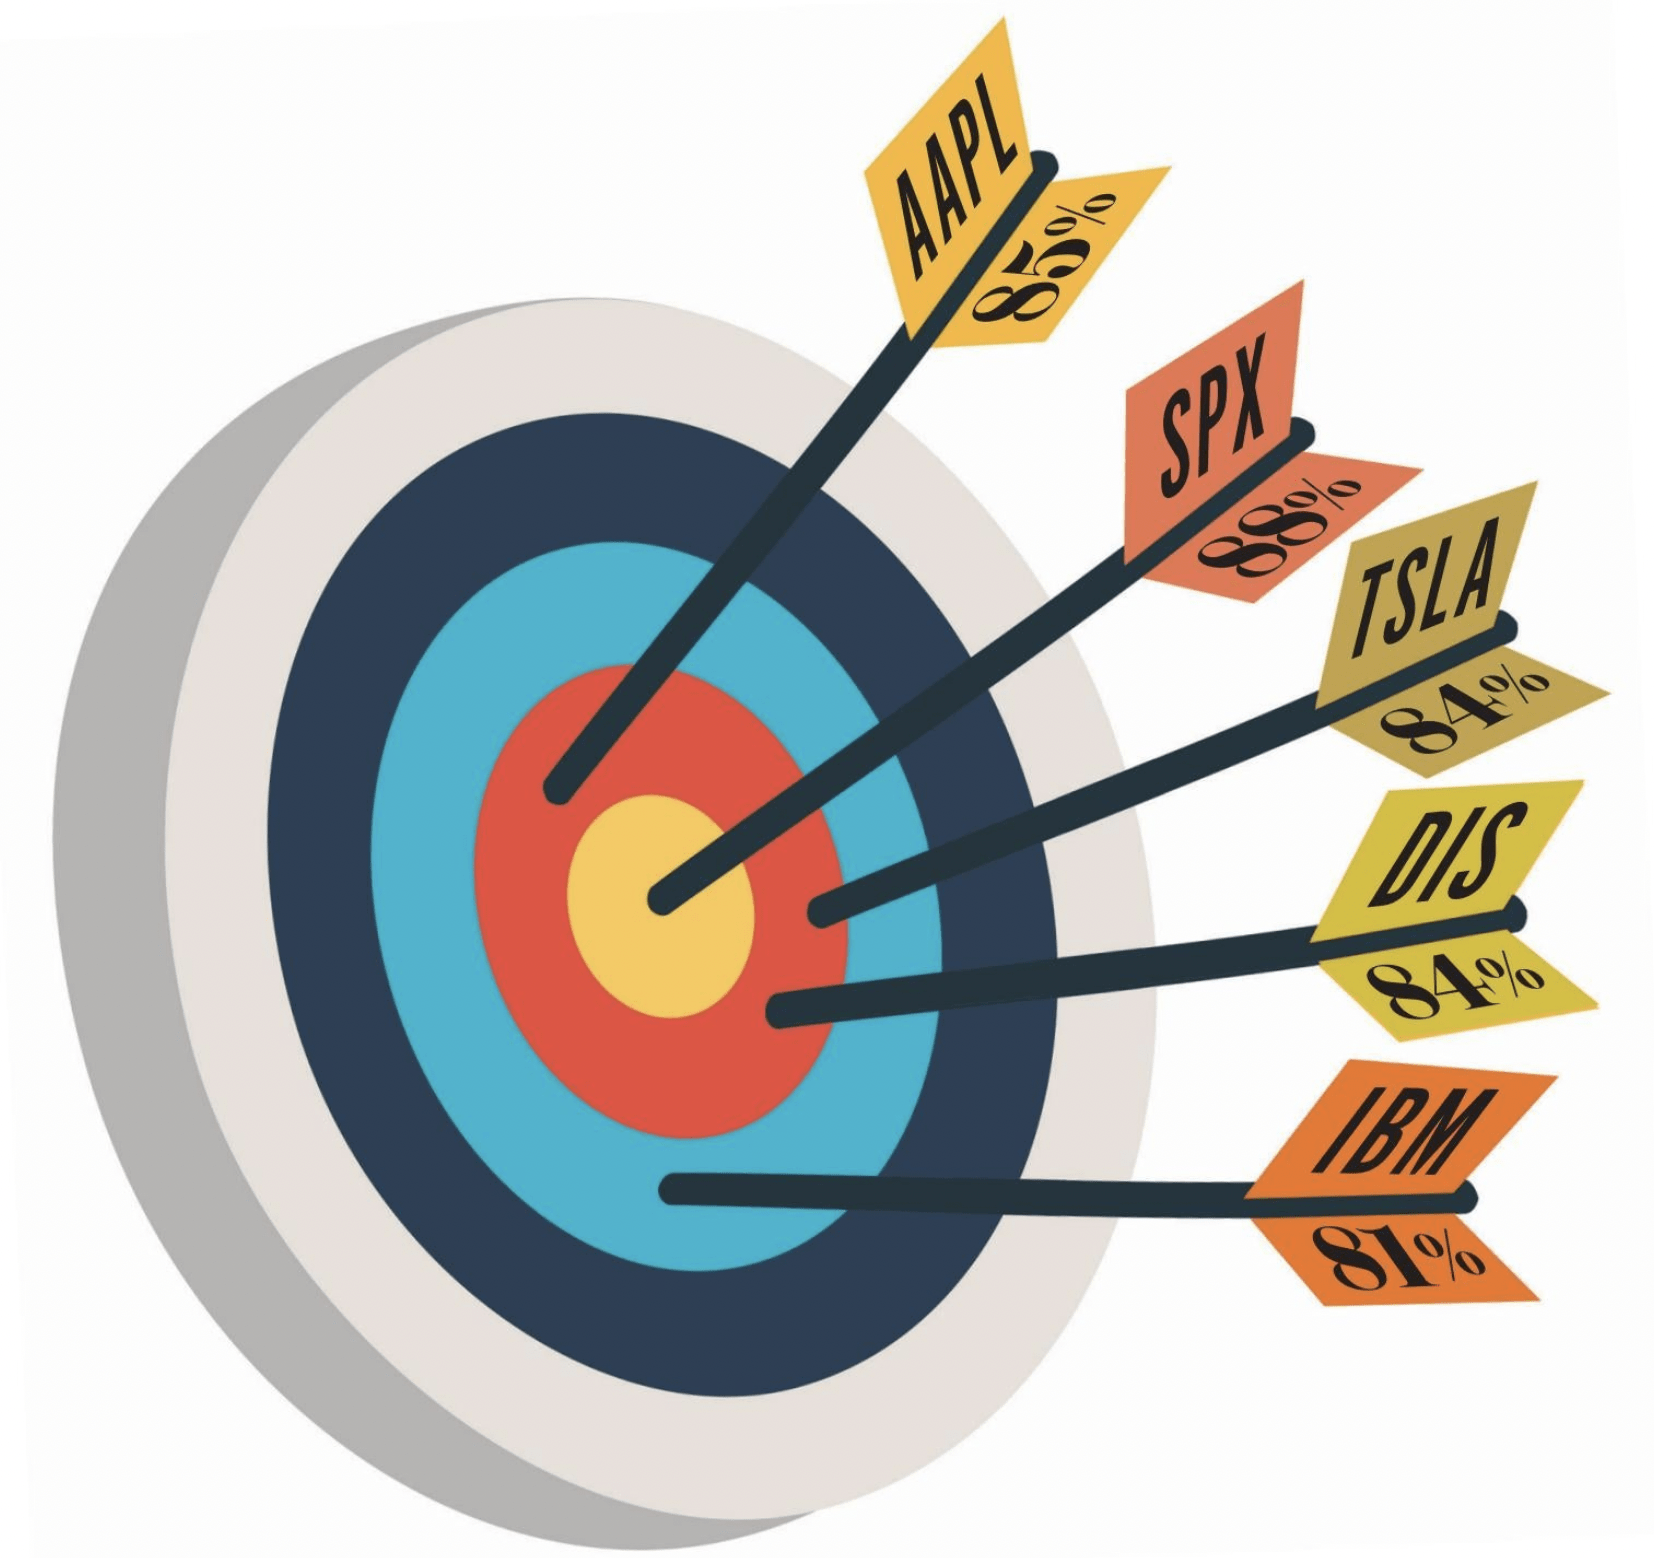
Active trading can include opening options trades in many symbols over time. Instead of sinking all of one’s capital into one stock or index and hoping it goes up, investors distribute capital and risk among a number of equities—think IBM (IBM), Apple (AAPL), Tesla (TSLA), etc.
Investing over a longer period and using strategies with a higher probability of profit can reduce a portfolio’s volatility and make potential returns more predictable.
The reason is mathematically straightforward. Volatility is another term for standard deviation. Standard deviation is simply the square root of variance. And the calculation for variance is influenced by the number of values in the data set.
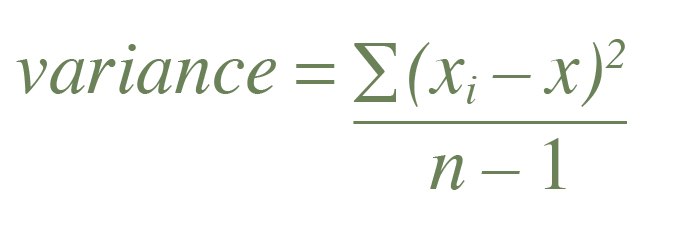
Variance is the average of the sum of the squared differences between the individual data points and their average, divided by the number of data points.
This is the formula for variance investors use when working with actual data, where
“xi” are the individual data points, and “x¯” is the average of those data points. Also, “n” is the number of data points available. Use “n-1” instead of just “n” because of the statistical concept of “degrees of freedom.”
That’s beyond the scope of this article, but suffice it to say “n-1” is used when working with the average of a sample instead of an unknown population mean.
When the divisor of a fraction is larger, the quotient is smaller, and that’s the case here. The more trades in an active trading strategy, the larger the “n-1” and the smaller the variance. The standard deviation (volatility) is the square root of variance. So, the lower the variance, the lower the volatility.
Consider a hypothetical strategy using high-probability trades. Assume a trader sells puts with a 70% probability of profit for $2.00 credit. The trade is closed for either a $100 profit or a $200 loss. The $100 profit occurs 70% of the time, and the $200 loss occurs 30% of the time. These are the volatilities (standard deviations) of the profit and loss of making 10, 20 and 100 trades.
Tom Preston, Luckbox contributing editor, is the purveyor of all things probability-based and the poster boy for a standard normal deviate. @thetompreston