10% Corrections Are Common, and Apple May Be Signaling That U.S. Stocks Are Primed for a Pullback
It may not seem like it right now, but it's likely the stock market will enter a 10% correction at some point in 2024

- The S&P 500 has rallied by about 8% in early 2024, but is up nearly 25% since October of last year.
- The breadth of the current rally has been relatively narrow, with most of the gains concentrated in the Magnificent 7.
- 10% corrections in the stock market are relatively common, and after the strong bull run, U.S. equities are starting to look susceptible to a near-term pullback.
It may not seem like it right now, but the stock market historically moves up and down. Due to that historical reality, it’s likely the stock will enter a 10% correction at some point in 2024. This is especially true given that 2024 is a presidential election year, which can be more volatile than an average trading year.
So far in 2024, the S&P 500 is up 8%, but since bottoming last October, it’s actually up nearly 25% in just four months. Last October, the S&P 500 bottomed out around 4,100 and today trades closer to 5,100.
Certainly the current narrative in generative AI has been a key catalyst for the recent rally. Estimates suggest that new business investments in AI-focused technologies could top $200 billion globally through 2025.
However, the advent of generative AI won’t change the fact that pricing in the financial markets remains imperfect. There are times that the valuations overshoot the mark, just as there are times they undershoot the mark. Notably, however, most recent corrections in the stock market have been met by fierce support, and rapid rebounds.
Case in point, the COVID-19 fueled correction in early 2020 quickly whipsawed into one of the fastest rebounds in market history. The most recent market rebound, from October 2023 to present, has been equally impressive.
On the other hand, the stock market may need fresh leadership to extend the current rally, and that could be in short supply. For example, the much anticipated interest rate cut that was expected for March has been pushed back to June, at the earliest. While Nvidia’s (NVDA) recent run has been nothing short of breathtaking, one wonders which sector or stock will lead from here.
One of the stock market’s previous darlings—Apple (AAPL)—has actually seen its shares trade lower in 2024. Shares in Apple have dropped by about 9% year-to-date and could slump further after a recent report indicated that consumers in China have been moving away from the iPhone in favor of Huawei’s latest Mate 60 Pro.
According to recent reports, iPhone sales in China dropped by roughly 24% during the first six weeks of 2024, as compared with the same period last year. And it appears that China’s Huawei has been the primary beneficiary. Huawei’s smartphone sales surged by 64% during the first six weeks of 2024.
Lockstep with Apple stock
In recent trading years, the S&P 500 has basically moved in lockstep with Apple stock. If one was up, so was the other. Last year, Apple shares rallied by about +48%, while the S&P rallied by +26%. Then, in 2022, Apple shares dropped by -26%, while the S&P 500 fell by -18%. Thus far in 2024, however, the S&P 500 is up by +8%, while Apple shares are down -9%.
One could easily argue that the advent of generative AI has transformed Nvidia into the world’s most important tech stock, in place of Apple. However, the recent divergence between the S&P 500 and Apple speaks to another problem with the current rally—its narrow breadth.
During the latest leg up in the stock market, most of the largest gains have been concentrated in a small group of companies, and that arguably makes the rally more susceptible to a retracement.
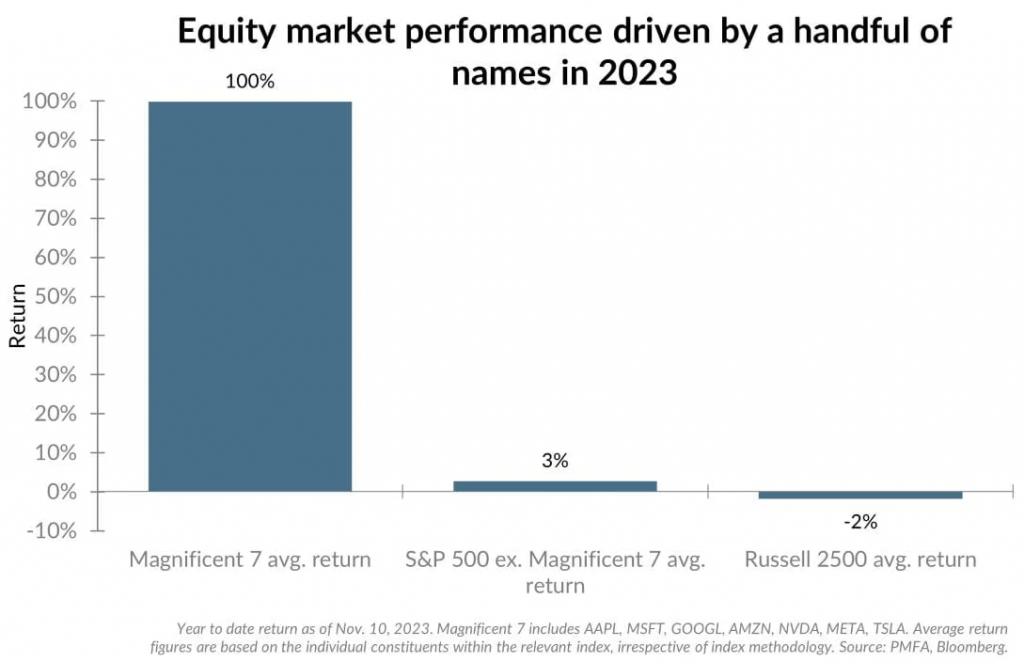
Last year, the companies that make up the Magnificent 7 returned on average about 107%, while the average return for a stock in the S&P 500 was far more modest. Through early November last year, the average stock in the S&P 500 was up around 3%, as illustrated below.

According to one Wall Street analyst, the current dynamic in the stock market is more characteristic of the latter stages of a rally, as opposed to the early part, or middle. Piper Sandler analyst Craig Johnson recently told CNBC, “This is a market that’s probably going to enter an HLTR, or a high-level trading range, and at this point in time being at the upper end of that channel, now is a time where this market is certainly vulnerable to see at least a 10% correction.”
In recent years, 10% corrections have become fairly common the S&P 500, which has corrected by at least 10% in three of the last four trading years (2020, 2022, 2023).
Based on that history, it’s hard to discount the possibility of a 10% correction in 2024, as well.
Current market valuations are reliant on strong 2024 earnings growth
One of the key complications with the current market rally is that valuations in the stock market appear to be heavily reliant on a strong second-half rebound in corporate earnings growth.
That may well be warranted, but it’s impossible to say if those projections will end up being accurate. Importantly, corporate earnings in the last quarter of 2023 were stronger than expected. Leading up to Q4 earnings, most analysts forecasted that corporate earnings would grow by 3-4% during the last three months of 2023.
The early returns from Q4 appear to indicate that corporate earnings grew at a faster pace than expected—closer to 7-8%, as opposed to 3-4%. That upside surprise has undoubtedly helped push stock valuations higher in early 2024. But the corporate sector is going to need to sustain that level of growth in order to meet the market’s lofty expectations for 2024.
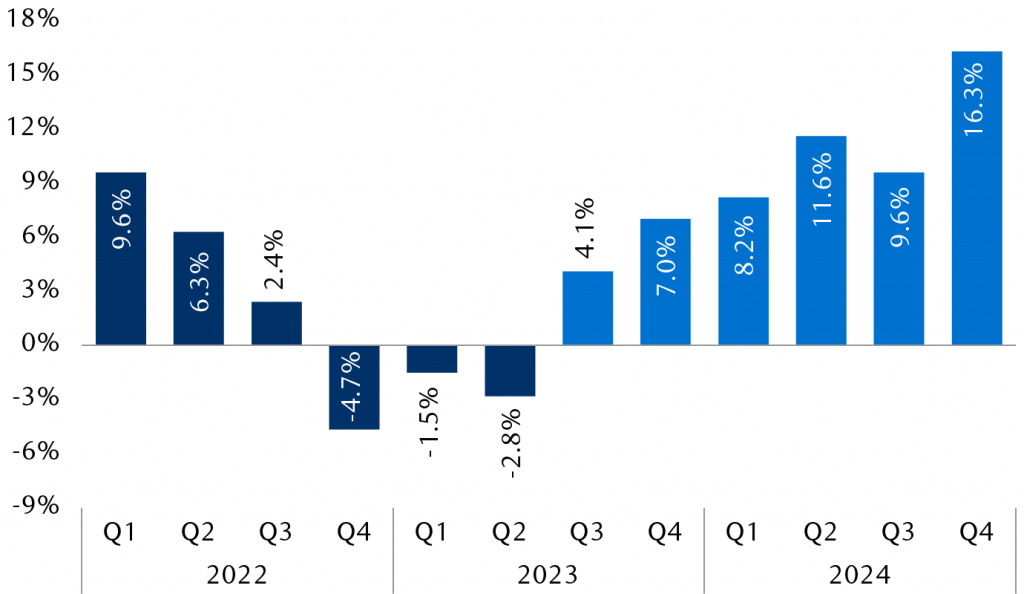
According to FactSet, corporate earnings for the S&P 500 are expected to grow by more than 11% during calendar year 2024. That figure is well above the 10-year average, which is closer to 8.4%. The majority of that rosy outlook appears to be concentrated in Q4 of 2024, when earnings are expected to jump by more than 16%, as highlighted below.

Corporate profit margins are projected to surge back toward record highs during the second half of 2024. That outlook dovetails well with the aforementioned projections on favorable quarterly earnings growth. But it also adds gravity to the prediction.
If earnings and profit margins fall short of expectations, it’s easy to see how bullish sentiment in the stock market could weaken.
(P/E) for the S&P
At present, the forward price/earnings (P/E) for the S&P 500 is hovering around 23. That’s down from last quarter, when it was closer to 25, but it’s still higher than the long-term average of roughly 18.
During the last decade, the forward P/E for the S&P 500 has ranged between roughly 18 and 40, which suggests that the current reading isn’t necessarily overextended. The only caveat is that the forward P/E relies heavily on aforementioned lofty 2024 earnings projections, which may be overly optimistic.
To put the market’s recent run in different terms, the S&P 500 has added more than $10 trillion in value since bottoming back in September 2022. Back then, the market capitalization of the S&P 500 was around $30 trillion.
Today, that figure is closer to $40 trillion.
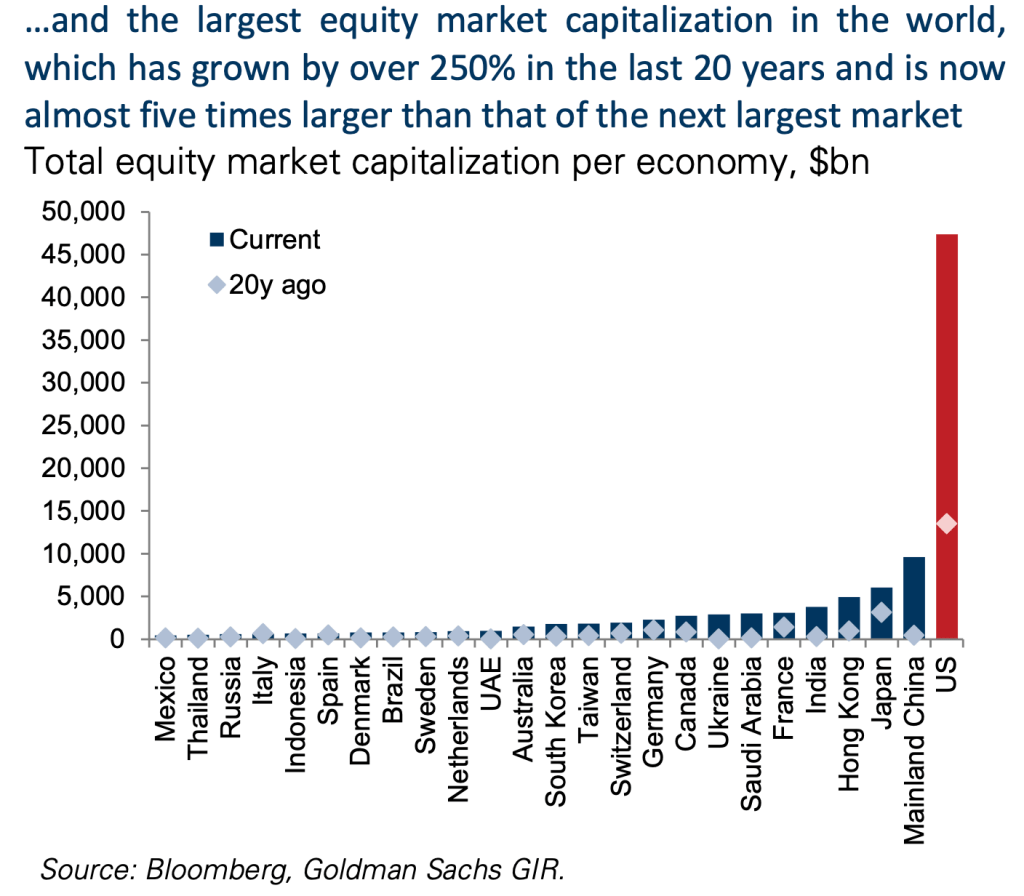
The overall market capitalization of the entire U.S. equity market now dwarfs the rest of the world, as illustrated below.

One must keep in mind that most of the world’s largest and best-known technology companies are headquartered in the United States. From that perspective, the sky-high valuations of the overall American equity market makes some sense.
On the other hand, from a relative valuation standpoint, one could argue that some of the world’s other key equity markets are looking attractive at this time, especially the downtrodden Chinese stock market.
Considering the recent bull run in American stocks, it’s easy to see how U.S. stocks could correct by 10% at some point in the foreseeable future.
To trade the major American market indices, most market participants use index ETFs such as the SPDR S&P 500 ETF Trust (SPY). In addition to SPY, some other well-known index ETFs include the SPDR Dow Jones Industrial Average ETF Trust (DIA), the Invesco QQQ Trust Series 1 (QQQ) and the iShares Russell 2000 ETF (IWM).
Andrew Prochnow has more than 15 years of experience trading the global financial markets, including 10 years as a professional options trader. Andrew is a frequent contributor Luckbox magazine.
For live daily programming, market news and commentary, visit tastylive or the YouTube channels tastylive (for options traders), and tastyliveTrending for stocks, futures, forex & macro.
Trade with a better broker, open a tastytrade account today. tastylive, Inc. and tastytrade, Inc. are separate but affiliated companies.


