This Bubble is in Trouble: Signs the Market May Be Running Out of Steam
Is the AI-driven rally overextended? These metrics say ‘Yes,’ and if the tech giants stumble, the market will follow.

- The European Central Bank has warned that U.S. stocks, particularly those tied to artificial intelligence, may be entering bubble territory.
- From the Buffett indicator to the S&P 500’s price-to-book ratio, multiple measures suggest the market is significantly overvalued, raising concerns about sustainability.
- Persistently strong earnings from a handful of leading tech firms have buoyed the market, but their dominance and concentration leave the rally vulnerable to sudden shifts in sentiment.
The U.S. stock market has soared to dizzying heights, with valuations that some experts argue are untethered from economic reality. But beneath the surface of record-breaking valuations, cracks may be forming. And on Nov. 20, The European Central Bank (ECB) issued a stark warning that U.S. stocks—particularly those tied to artificial intelligence (AI)—may be entering bubble territory.
In the opinion of these bankers, valuations in the AI sector could face a sharp correction when earnings start to falter, potentially triggering a correction in the financial markets.
While persistently strong earnings from some of the world’s best-known tech leaders have buoyed broader indexes and fueled bullish sentiment, questions remain about how long this momentum can last. Elevated interest rates, geopolitical uncertainty and a fragile global economy are casting shadows over the rally, raising doubts about its durability.
Let’s explore key data points and expert commentary behind these growing concerns, examining the metrics, historical precedents and risks that could challenge today’s frothy markets.
Buffet indicator flashes red
Among the metrics suggesting the market may be overextended, the Buffett indicator—popularized by legendary investor Warren Buffett—stands out as particularly revealing. By comparing the total market capitalization of U.S. equities to the nation’s gross domestic product (GDP), it offers a clear perspective on how financial markets stack up against the real economy. Its latest reading highlights the growing disconnect between soaring stock prices and economic fundamentals, raising further concern about whether current valuations are sustainable.
Calculating the ratio is relatively straightforward. The total U.S. market value reflects the aggregate worth of publicly traded companies, typically measured using indices like the Wilshire 5000. This figure captures investor expectations of future economic performance, encompassing both optimism and speculation. GDP, on the other hand, represents the tangible output of the U.S. economy, growing steadily over time and serving as a more stable benchmark. When the stock market value soars well beyond GDP, it signals a potential disconnect between market pricing and economic reality.
At the end of Q3, the indicator stood at roughly 208%, with the combined market value of $60.9 trillion far exceeding the annualized GDP of $29.2 trillion. This extraordinary level places the market firmly in “strongly overvalued” territory, well beyond its historical trend line and echoing peaks seen in previous periods of speculative excess, as illustrated below.
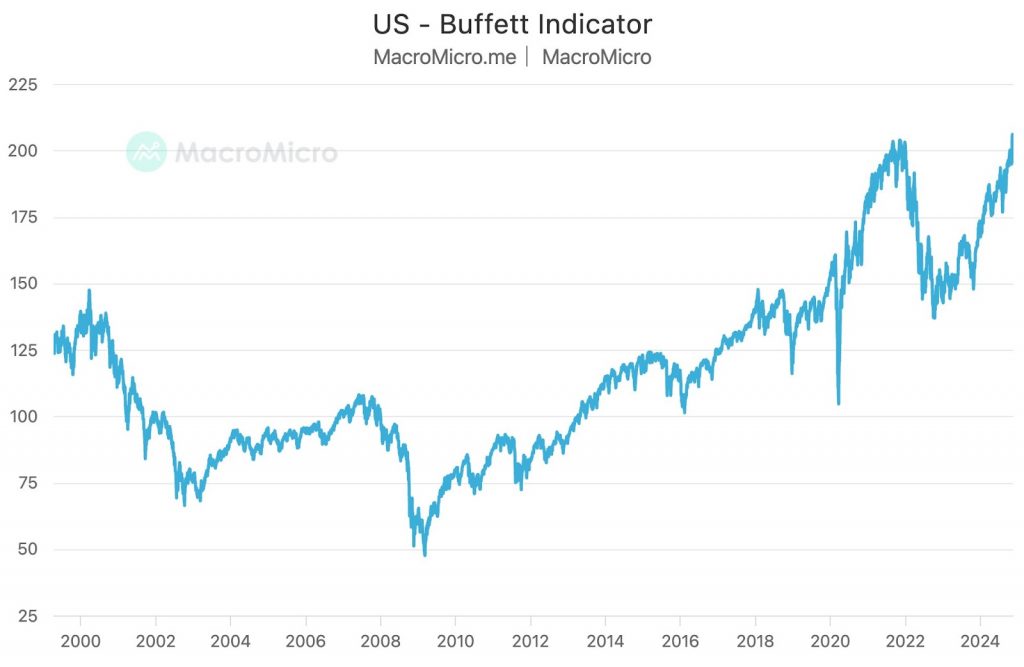
The Buffett Indicator’s current level is particularly striking when viewed in historical context. It has reached such extreme levels on only a few occasions, most notably during the dot-com bubble in 2000, when it rose above 150%, and just before the market correction in late 2021, when it peaked near 200%. Today’s record-breaking level of 208% surpasses these prior peaks, pointing to valuations that appear increasingly unconnected from economic fundamentals. This surge is largely fueled by speculative enthusiasm, especially in the technology sector, compounded by years of low interest rates that have driven investors toward equities in search of higher returns.
Some observers argue that factors like globalization and technological innovation have naturally elevated the ratio over time. Yet today’s level far exceeds the exponential growth trend established since the 1970s. Historically, such pronounced deviations have rarely endured without leading to a market correction. The Buffett indicator serves as a reminder of the risks inherent in overextended valuations, offering a cautionary signal for the current market.
Price-to-book ratio rises to worrisome level
The S&P 500 price-to-book (P/B) ratio is another metric investors can use to assess valuations in the stock market. It measures the market value of companies in the S&P 500 relative to their book value, and it’s calculated by dividing the market price per share by the book value per share. The book value represents the net asset value of a company—its total assets minus total liabilities. A rising P/B ratio often reflects heightened market expectations for growth and profitability, but it can also signal valuations are becoming excessive.
As of Nov. 15, 2024, the P/B ratio for the S&P 500 was above 5, which is uncomfortably close to the metric’s all-time high of roughly 5.3, and well above the median historical value of 2.9. Moreover, the current level is 23% higher than it was a year ago. A sharp increase suggests investors are pricing in optimistic assumptions about future profitability despite the possibility these expectations may not align with the underlying fundamentals of many companies.
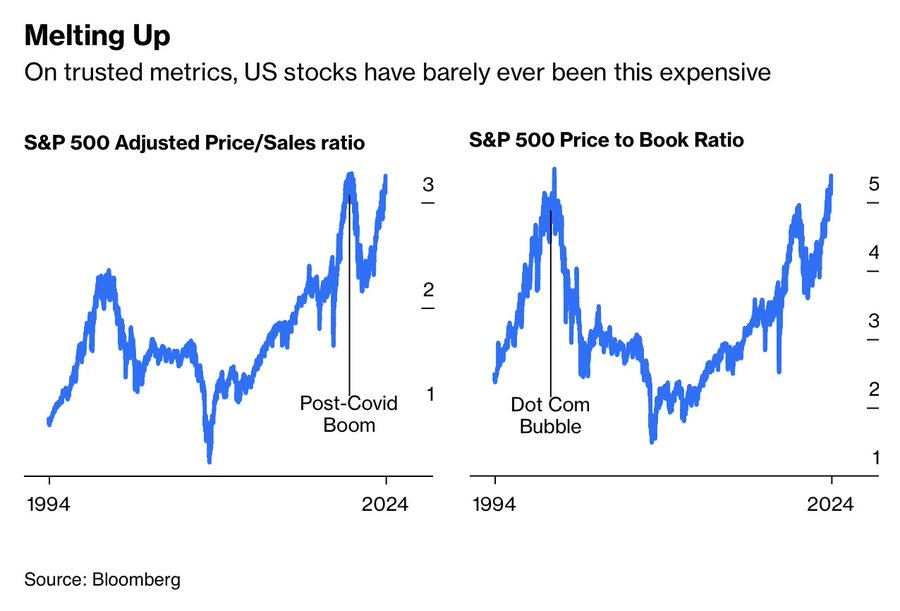
Historically, elevated price-to-book (P/B) ratios have often foreshadowed market corrections, as inflated valuations tend to falter under shifting economic or financial conditions. The current P/B ratio of the S&P 500 highlights how investor sentiment has surged well beyond the intrinsic value of corporate assets, underscoring a broader trend of speculative excess in equity markets. When viewed alongside other metrics, such as the Buffett indicator, the P/B ratio reinforces a consistent narrative: U.S. equity markets are trading at levels that exceed historical norms.
While recent breakthroughs in artificial intelligence and other technological advances have generated excitement, they don’t necessarily justify heightened valuations. Instead, there appears to be a growing disconnect between market pricing and economic fundamentals, amplified by elevated interest rates and a range of geopolitical challenges. For investors, the elevated P/B ratio serves as a signal of caution, emphasizing the risk that comes with navigating a potentially overextended market.
Corroborating signs of an overheated market
Beyond individual valuation metrics, several prominent voices and studies underscore the argument that the equity markets are significantly overextended. Billionaire investor David Einhorn, for instance, recently emphasized this point in his quarterly letter, noting that “the stock market is the most expensive it’s been in decades.”
Einhorn pointed to Buffett’s recent actions as indicative of caution; the Oracle of Omaha has been selling significant equity positions and amassing record cash reserves, signaling a strategic withdrawal from what Greenlight Capital views as an overheated market. Einhorn observed that even non-tech stocks, often regarded as relatively stable, are trading at inflated multiples of 30 to 50 times earnings, levels not seen since the firm’s inception in 1996.
Adding weight to the argument, the S&P 500 currently accounts for an extraordinary 51% of the global stock market’s value. This outsized dominance underscores the extent to which U.S. equities have outperformed global markets, but it also raises concern about concentration risk. The sheer scale of the S&P 500’s valuation relative to the rest of the world is unprecedented, reflecting heightened expectations for U.S. companies that may be difficult to achieve.
A study by Jennifer Nash reinforces the overvaluation narrative. Examining a range of metrics—including cyclically adjusted price-to-earnings ratios, the Q ratio and regression-to-trend analyses—Nash found the market is overvalued by 107% to 177%, depending on the indicator, with the average valuation standing more than three standard deviations above its historical mean. This level of overvaluation, while not a short-term predictor of market direction, serves as a clear signal of stretched valuations that could temper future returns.
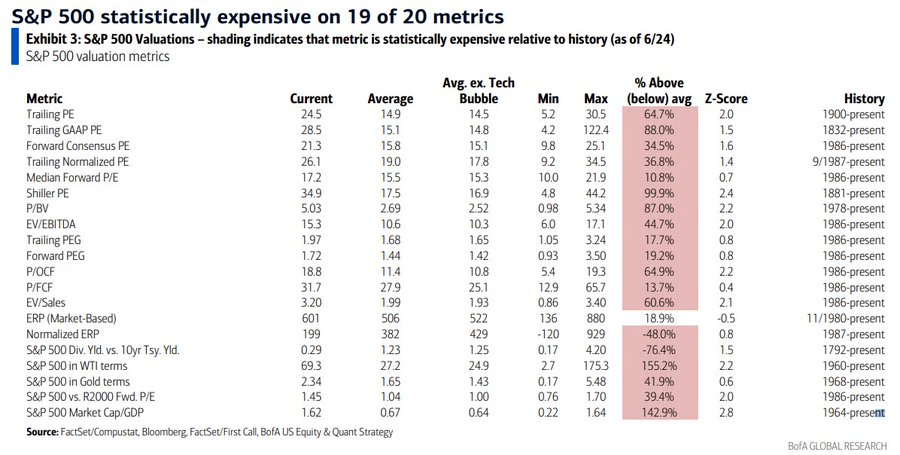
Research by the Bank of America provides another critical perspective. It found the S&P 500 “statistically expensive” by 19 of 20 valuation metrics. That includes widely followed measures, such as forward price-to-earnings ratios and dividend yields, many of them flashing red as equities continue to trade at historically elevated prices. The breadth of evidence from this analysis suggests the overvaluation extends across multiple dimensions, making the case for caution even more compelling.
Economic weakness could spell trouble for the markets
The stock market’s elevated valuations have prompted unease among investors and analysts alike, but the timing of a pullback remains as elusive as ever—especially in a market powered by unyielding bullish sentiment. Central to the rally are a handful of American tech giants whose extraordinary earnings have not only lifted the broader indexes but also set the tone for investor confidence. These companies, as market leaders, serve as bellwethers; any stumble in their performance, or a broader shift in sentiment, could rewrite the narrative.
Still, the most formidable challenge to these valuations isn’t confined to isolated earnings disappointments—it’s the underlying economy. History is unambiguous in its verdict: recessions and depressions have had a devastating effect on inflated markets, dragging valuations down as corporate profits shrink and optimism fades. Should the economy weaken, the weight of fundamental deterioration would almost certainly push stock prices back down to more grounded levels. For now, the market’s momentum persists yet remains vulnerable to a sudden change in sentiment—hinting that the rally may be shakier than it appears.
That said, some argue this time could be different. Supporters of the bullish case point to artificial intelligence, consumer spending and resilient corporate earnings as reasons why elevated valuations might hold longer. This perspective undoubtedly has merit, and we explore these arguments in a companion article on why current valuations could prove durable.
Andrew Prochnow has more than 15 years of experience trading the global financial markets, including 10 years as a professional options trader. Andrew is a frequent contributor Luckbox magazine.
For live daily programming, market news and commentary, visit tastylive or the YouTube channels tastylive (for options traders), and tastyliveTrending for stocks, futures, forex & macro.
Trade with a better broker, open a tastytrade account today. tastylive, Inc. and tastytrade, Inc. are separate but affiliated companies.


