How to Use the Sharpe Ratio
The Sharpe Ratio is widely used to measure the performance of a given investment approach as compared to the degree of risk involved, but the metric isn’t ideal for evaluating short options/volatility trading approaches.

In the financial world, the Sharpe Ratio (aka the “Sharpe Index,” the “Sharpe Measure,” or the “Reward-to-Variability Ratio”) is frequently used to measure the performance of an investment (i.e. security, strategy, fund or portfolio) as compared to the performance of a risk-free asset, when adjusting for the relative risk of each approach.
The Sharpe Ratio helps market participants understand the risk-adjusted returns of different trading approaches or investment strategies, as compared to the degree of risk taken to earn those returns.
The Sharpe ratio was developed by American economist and Nobel laureate William F. Sharpe in 1966. The simplicity of the Sharpe Ratio, as compared to other risk/return metrics, is likely a big reason for its popularity as a risk management tool.
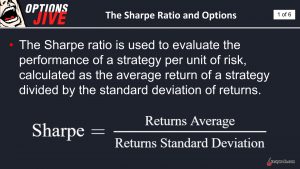
From a mathematical perspective, the ratio calculates the difference between the returns, or expected returns, of a given security/strategy/fund and the current risk-free return, which is then divided by the standard deviation (i.e. volatility) of the security/strategy/fund in question. Normally, the 90-day U.S. Treasury bill rate is used as a proxy for the risk-free rate.
To calculate a Sharpe ratio, one subtracts the return of the 90-day U.S. Treasury bill from the return of the security/strategy/fund in question. That figure is then divided by the standard deviation of the security/strategy/portfolio, as shown below.
Looking at an example, imagine an investment strategy hypothetically produces a return of 15% with a standard deviation of 10. Assuming the U.S. Treasury bill returned 2%, the fund’s Sharpe ratio would therefore be 1.3, or (15-2)/10 = 1.3.
In general, higher Sharpe ratios are viewed as more attractive. A Sharpe ratio of 1 is considered good, 2 is better, and anything above 3 is considered excellent. Intuitively, it can be further inferred that the Sharpe Ratio of a risk-free asset is zero.
The Sharpe Ratio basically represents the additional amount of return that an investor/trader receives per unit of increased risk, which is why Sharpe Ratios above 2 are preferred.
Considering the above, one can see why the Sharpe Ratio is frequently used to determine whether the increased risk associated with a given investment strategy is justified.
The Sharpe Ratio was recently covered in detail by the tastytrade financial network on a new episode of Options Jive. The intent of this episode was to help explain one shortcoming of the Sharpe Ratio—namely its suboptimal ability to analyze short options trading/investment approaches.
On the show, the hosts outline why the Sharpe Ratio is most effective when comparing the performance of securities/strategies/funds in which the distribution of returns is “normal.”
That in turn means that when considering return distributions with large amounts of skew—such as those affiliated with short options/volatility—the standard deviation (and therefore the Sharpe Ratio) doesn’t efficiently capture the complete risk dynamic—particularly when it comes to tail risk.
As such, it’s not optimal to compare various short options trading approaches using the Sharpe Ratio. Instead, the tastytrade network offers up several other metrics that market participants can use to analyze the associated risk/reward dynamic of short options trading strategies.
As outlined in the graphic below, these criteria include: average P/L, volatility of P/L, conditional value at risk (CVaR) and largest loss.
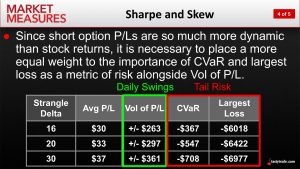
Average P/L, the volatility of P/L and largest loss are likely familiar terms for most market participants, but conditional value at risk (CVaR) may be somewhat new.
CVaR is a risk assessment that quantifies the degree of tail risk in a given security/strategy/fund. It’s inclusion specifically speaks to the shortcomings of the Sharpe Ratio as it relates to tail risk and short options.
To learn more about comparing short options strategies using these four criteria, readers may want to review a new installment of Market Measures on the tastytrade financial network when scheduling allows.
Additional background on the Sharpe Ratio is also available via the aforementioned episode of Options Jive.
For updates on everything moving the markets, readers can also tune into TASTYTRADE LIVE—weekdays from 7 a.m. to 4 p.m. CST.
Sage Anderson is a pseudonym. He’s an experienced trader of equity derivatives and has managed volatility-based portfolios as a former prop trading firm employee. He’s not an employee of Luckbox, tastytrade or any affiliated companies. Readers can direct questions about this blog or other trading-related subjects, to support@luckboxmagazine.com.